Escalating Prometheus alerts to SMS/Phone/Slack/Microsoft-Teams via AlertManager and Zenduty
Last updated
Prometheus is by far, one of the most popular open-source monitoring tools used by millions of engineering teams globally with a robust community and continued adoption and evolution.
We at Zenduty shipped our Prometheus integration integration a while back and we’re happy to report that the adoption of our Prometheus integration has been absolutely through the roof! Users on Zenduty use our Prometheus integration to get real-time alerts whenever any of their metrics(measured across thousands of servers and applications) cross their critical/warning thresholds that might indicate a degraded system performance. Zenduty collects these alerts from P_rometheus and escalates those alerts to the right on-call engineering teams via SMS, Voice call, Slack, Microsoft Teams, Email and Push notifications on our native Android and iOS applications. Zenduty ensures that these critical alerts are responded too quickly, attaches a bunch of relevant playbooks to the incident, automatically creates the communication channels like Slack channel, Teams channel, Zoom links, Jira tickets, etc and ensures swift remediation of critical, customer-impacting alerts and has proven to reduce your mean times to repair by 60-80%.
Zenduty uses Prometheus’s AlertManager to dispatch critical alerts to Zenduty. To integrate Prometheus with Zenduty you can follow the instructions here.
Step 1: Sign up on Zenduty. Create a team. Within the team, create a service. Navigate to your Service page and add a Prometheus integration. Point the service to one of your escalation policies.
Step 2: Go to your Prometheus Alertmanager Folder and open “alertmanager.yml”. Add the webhook url (copied in the earlier steps) under “Webhook Configs”. Your “alertmanager.yml” file should now look like this:
global:
   resolve_timeout: 5m
 route:
   group_by: ['alertname', 'cluster', 'service']
   group_wait: 30s
   group_interval: 5m
   repeat_interval: 3h
   receiver: 'web.hook'
 receivers:
 - name: 'web.hook'
   webhook_configs:
   - url: 'https://zenduty.com/api/integration/prometheus/8a02aa3b-4289-4360-9ad4-f31f40aea5ed/'
 inhibit_rules:
   - source_match:
       severity: 'critical'
     target_match:
       severity: 'warning'
     equal: ['alertname', 'dev', 'instance']
Step 3: In the Prometheus folder, open “prometheus.yml”. Add new rules files that you just created and set Target. Your “prometheus.yml” file should look like this:
global:
   scrape_interval:     15s # Set the scrape interval to every 15 seconds. Default is every 1 minute.
   evaluation_interval: 15s # Evaluate rules every 15 seconds. The default is every 1 minute.
   # scrape_timeout is set to the global default (10s).
 # Alertmanager configuration
 alerting:
   alertmanagers:
   - static_configs:
     - targets: ["localhost:9093"]
 # Load rules once and periodically evaluate them according to the global 'evaluation_interval'.
 rule_files:
   - "first_rules.yml"
   # - "second_rules.yml"
 # A scrape configuration containing exactly one endpoint to scrape:
 # Here it's Prometheus itself.
 scrape_configs:
   # The job name is added as a label `job=<job_name>` to any timeseries scraped from this config.
   - job_name: 'prometheus'
     # metrics_path defaults to '/metrics'
     # scheme defaults to 'http'.
     static_configs:
     - targets: ['localhost:9090']
Step 4: Restart your Prometheus and AlertManagers.
run prometheus: ./prometheus --config.file=prometheus.yml
run alertmanager: ./alertmanager --config.file=alertmanager.yml
Your Zenduty-Prometheus integration setup is now complete
Prometheus fired a critical alert. Now what?
Whenever Zenduty receives a critical alert about a group or cluster or service from Prometheus via the AlertManager, Zenduty takes the alert and triggers an incident. When a “resolved” alert is sent from Prometheus, the incident is auto-resolved on Zenduty.
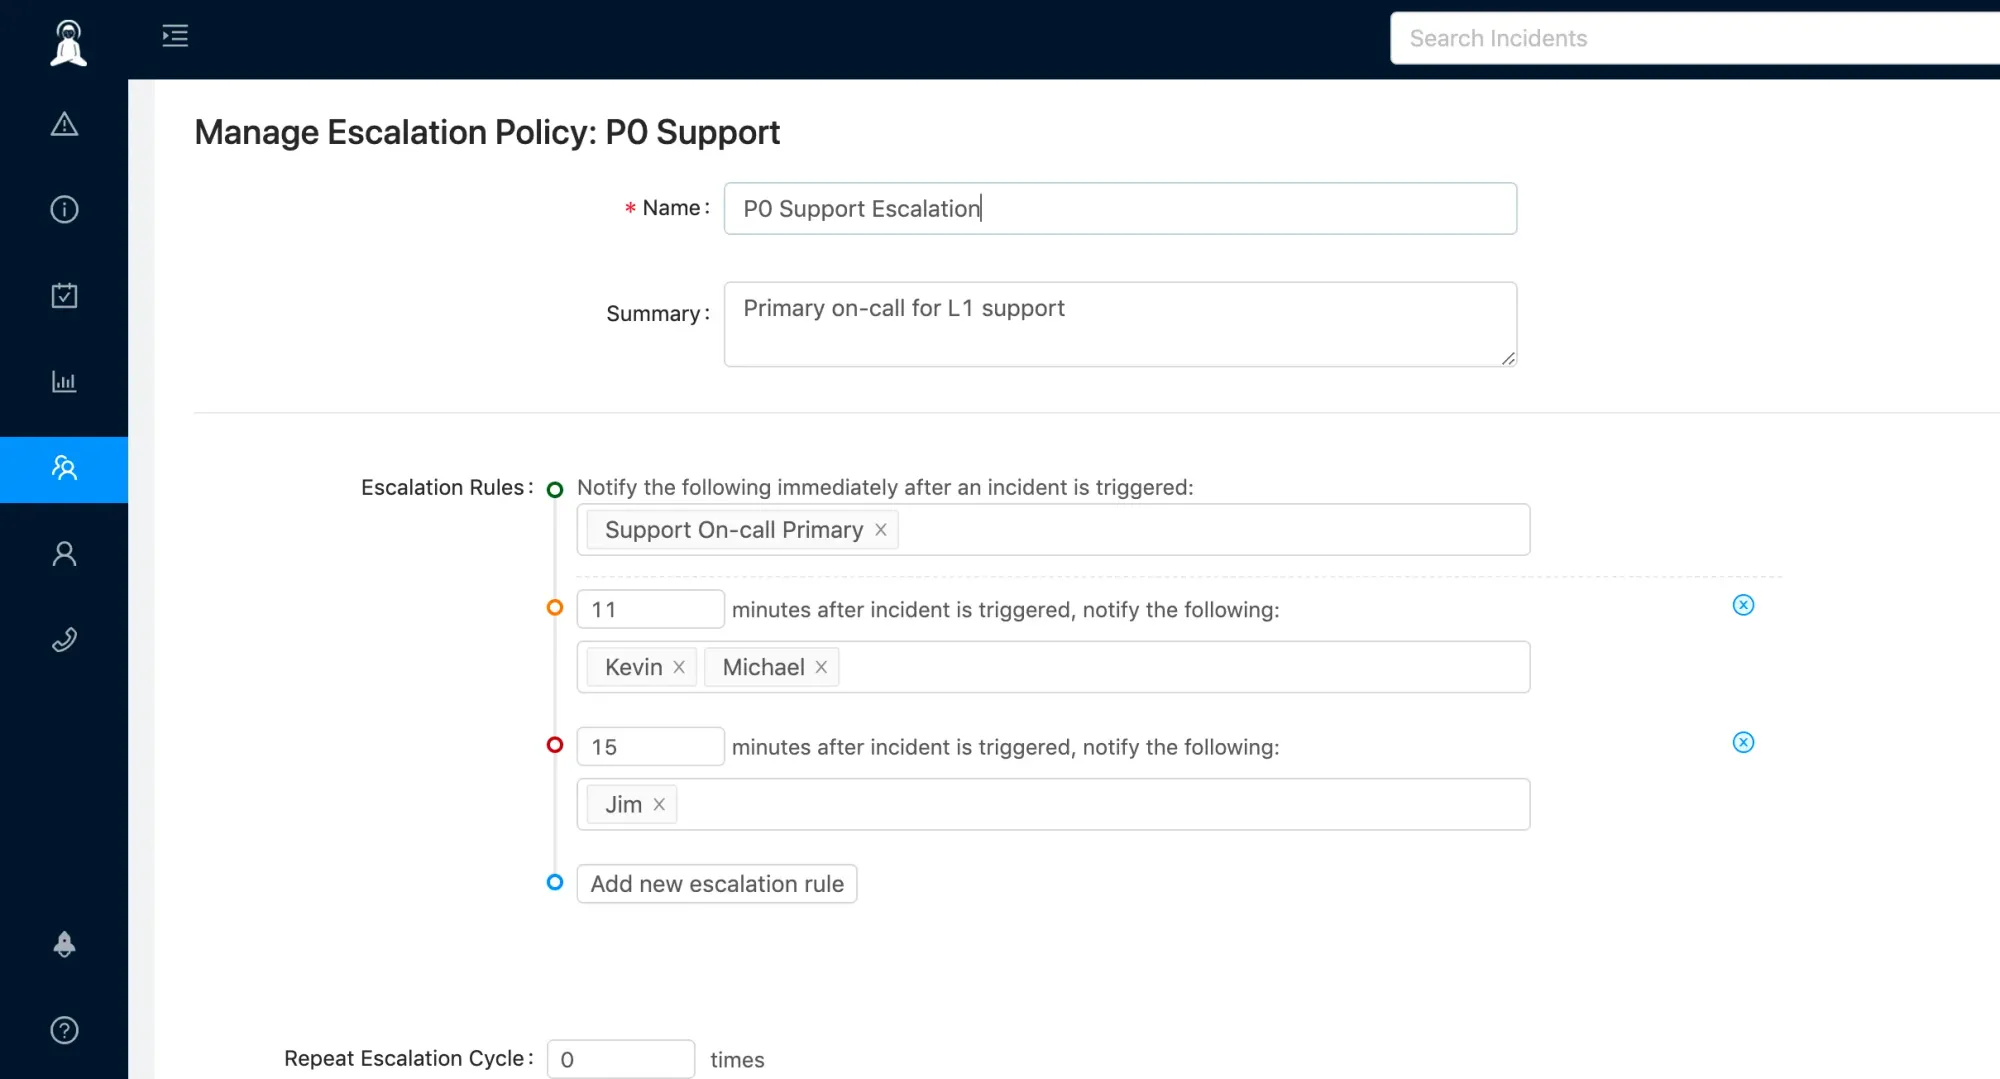
When an incident is in the triggered state, Zenduty executes the service’s escalation policy and starts alerting the users through their defined notification channels as they appear within the escalation policy. If a user does not acknowledge within a specified period of time, Zenduty alerts the next users within the escalation policy.
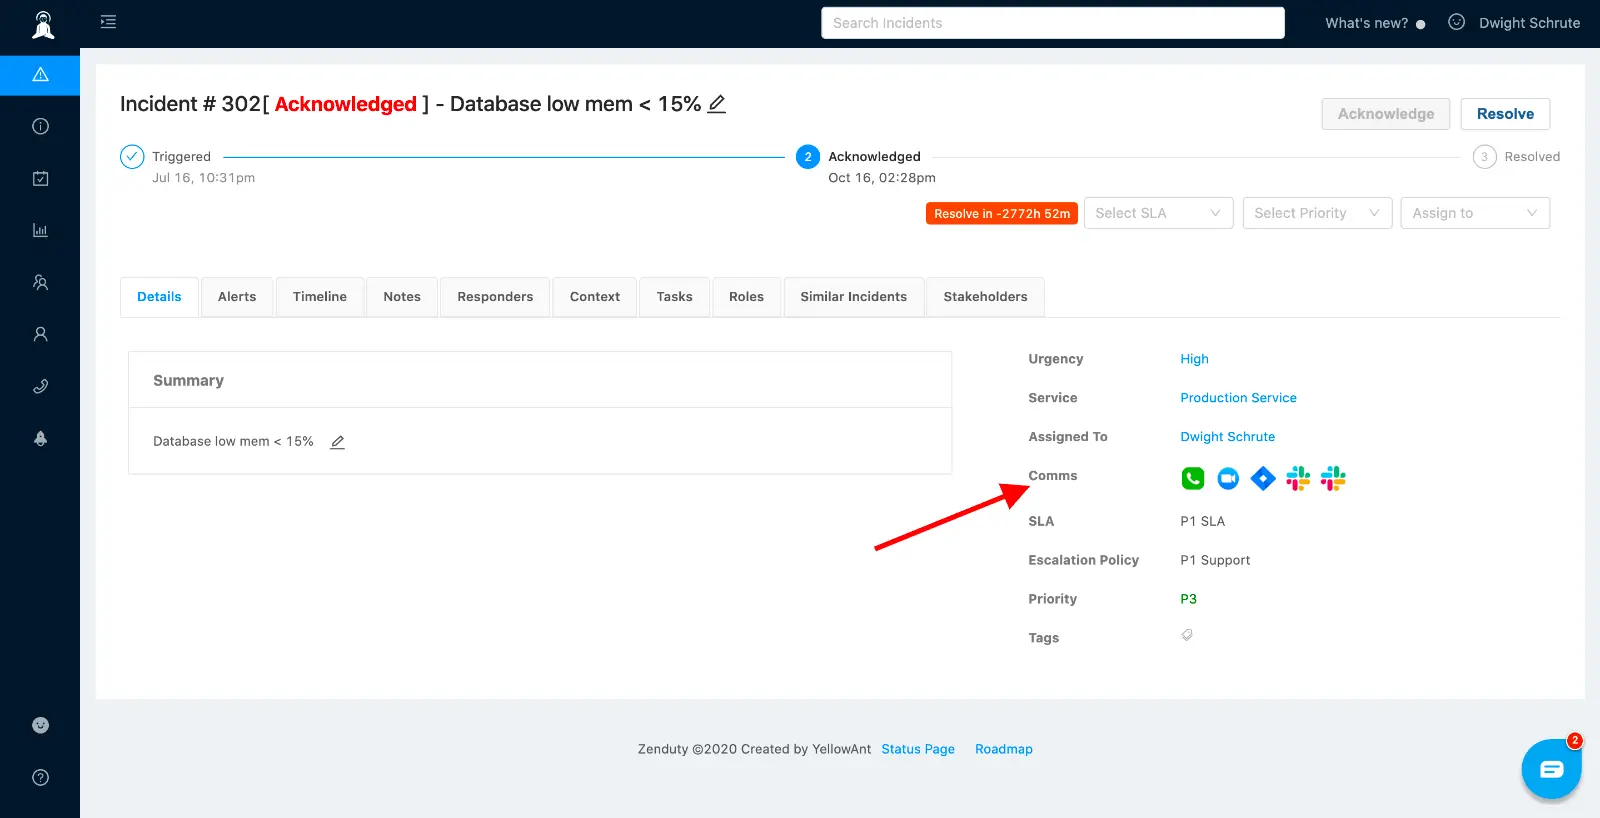
Comms
Zenduty automatically creates the comms channels for the incidents. You can setup outgoing integrations within tools like Slack, Teams, Zoom, Jira, Statuspage, etc. When an incident is triggered or updated, Zenduty can automatically:
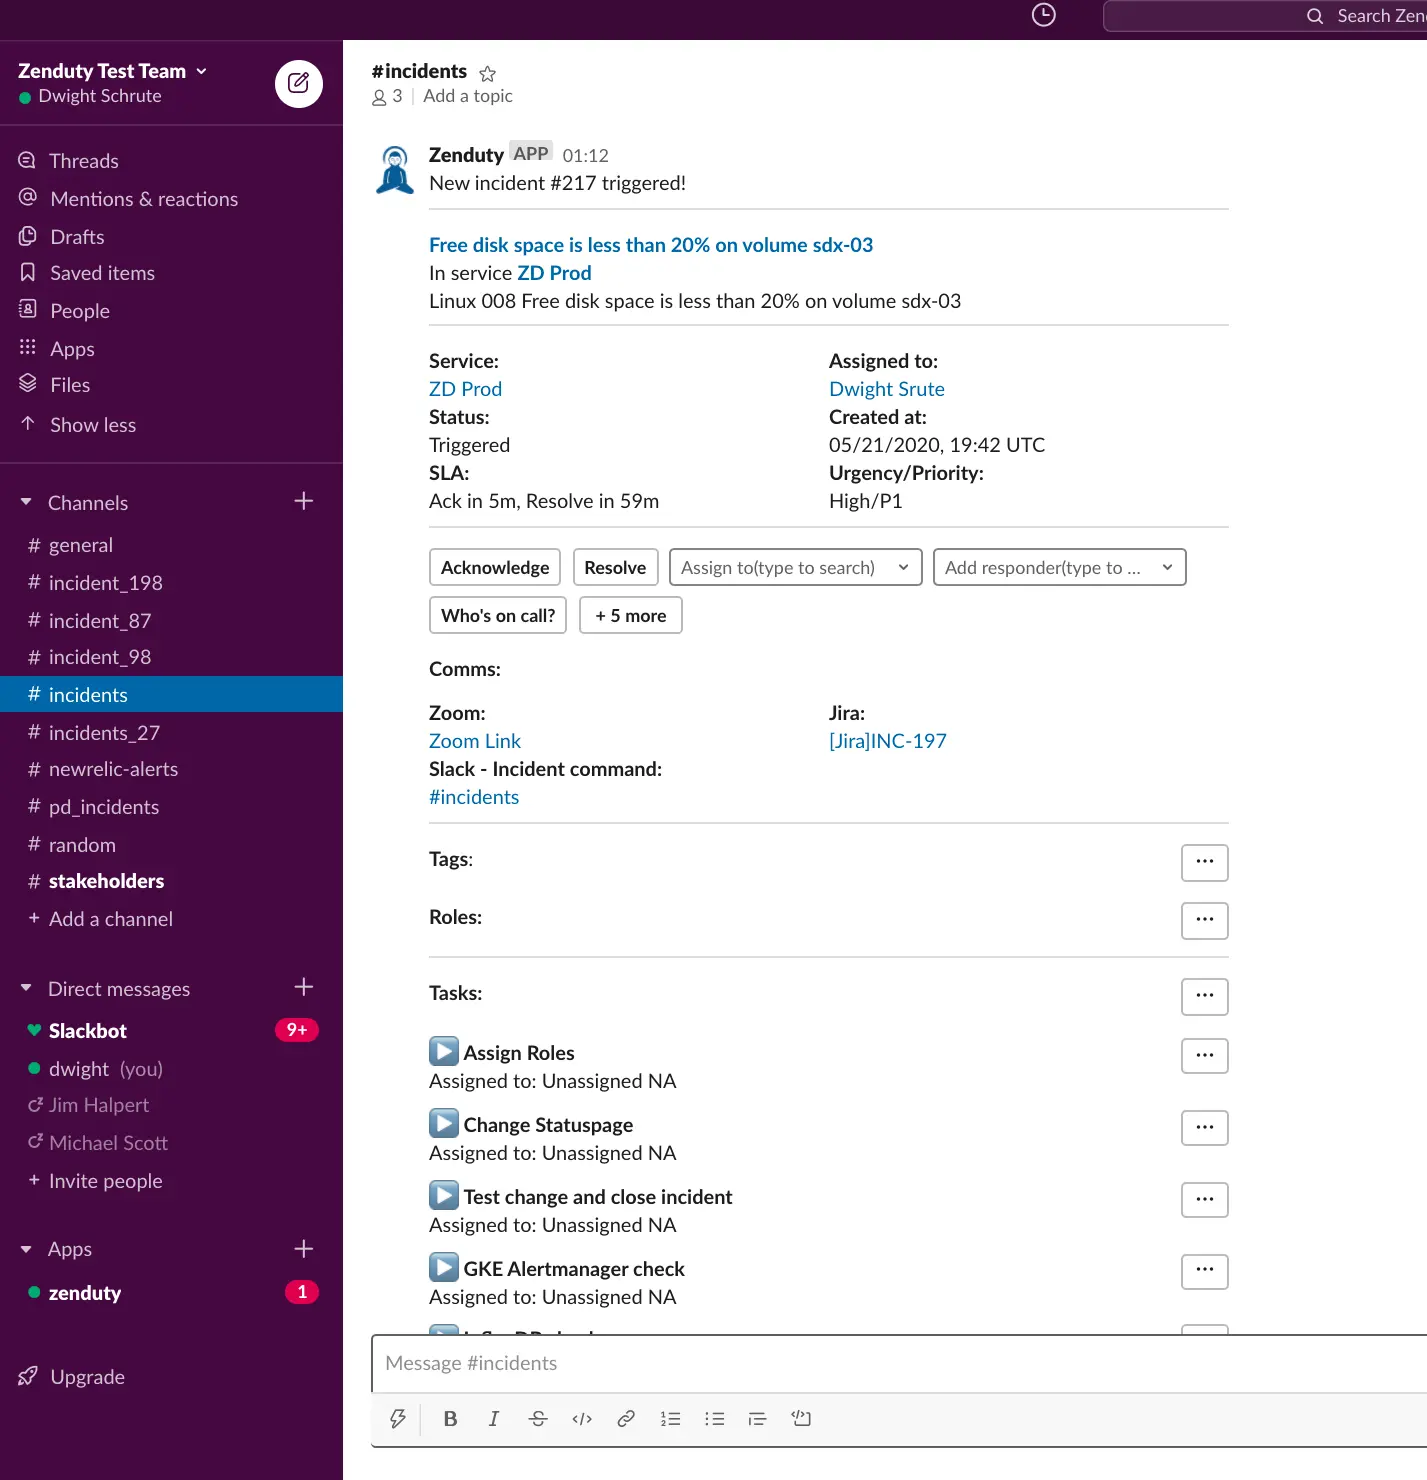
- Send the incident alerts to a Slack channel
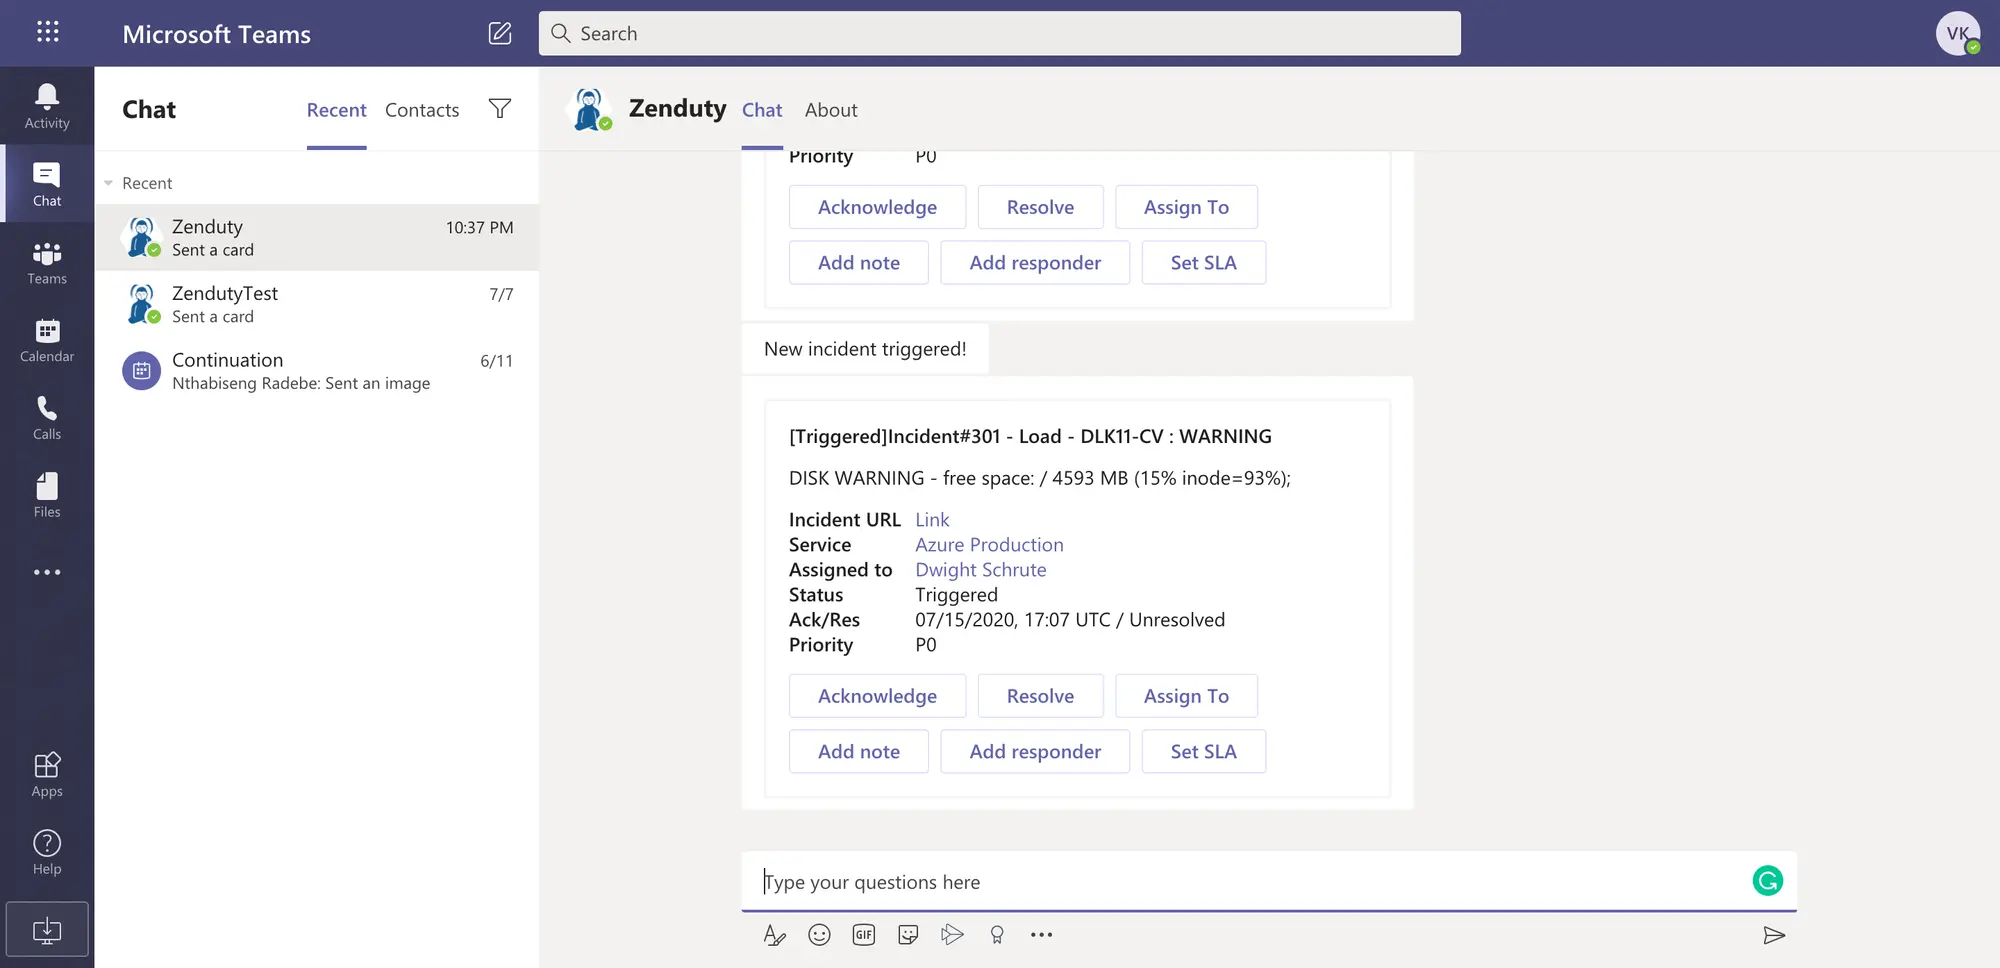
- Send the incident alerts to a Microsoft Teams channel
- Create a dedicated Zoom/Hangouts link for real-time audio/video conference call around the incident
- Create a two-way mapped Jira ticket
- Update your Statuspage
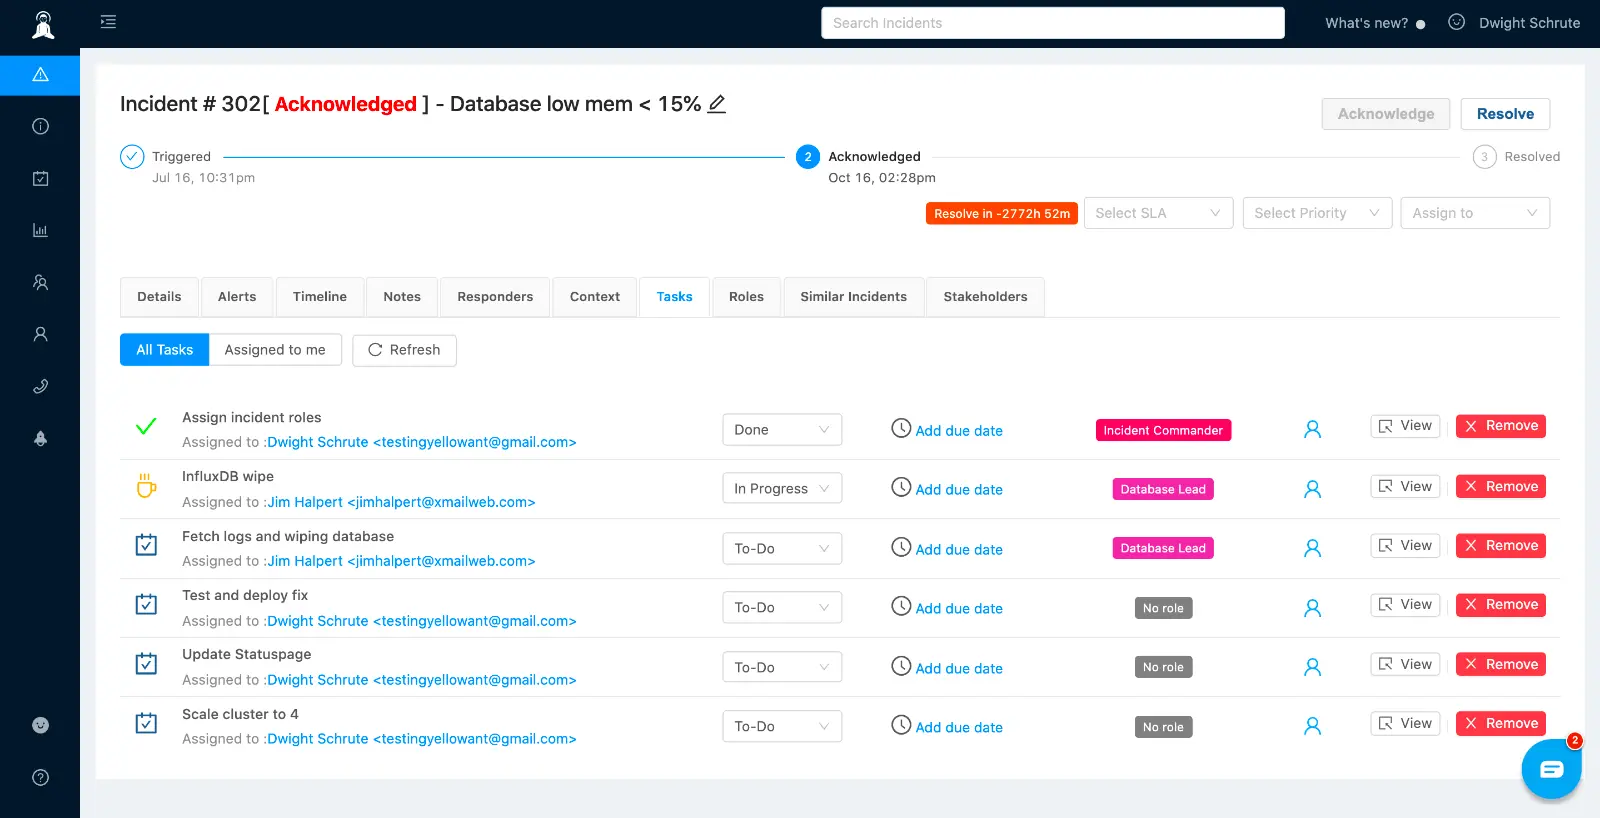
Advanced incident response - Roles and Tasks
Zenduty provides your incident responders with a high-level overview of the problem along with relevant contextual information and updates on the progress of any incident. Whenever an incident is triggered in Zenduty, the on-call engineer, after receiving the page, may acknowledge the incident and then claim the incident commander or ask someone else to take command. Incident managers can also enable recursive separation of roles and responsibilities to enable effective and scalable task delegation during a critical incident. The incident commander after having added the relevant responders and subject matter experts, can then invite those responders to take up specific roles, assign tasks to those roles and update the incident status on the go. Zenduty also allows you to import existing runbooks and playbooks as specific incident sub-tasks which can be tracked within the incident Tasks section.
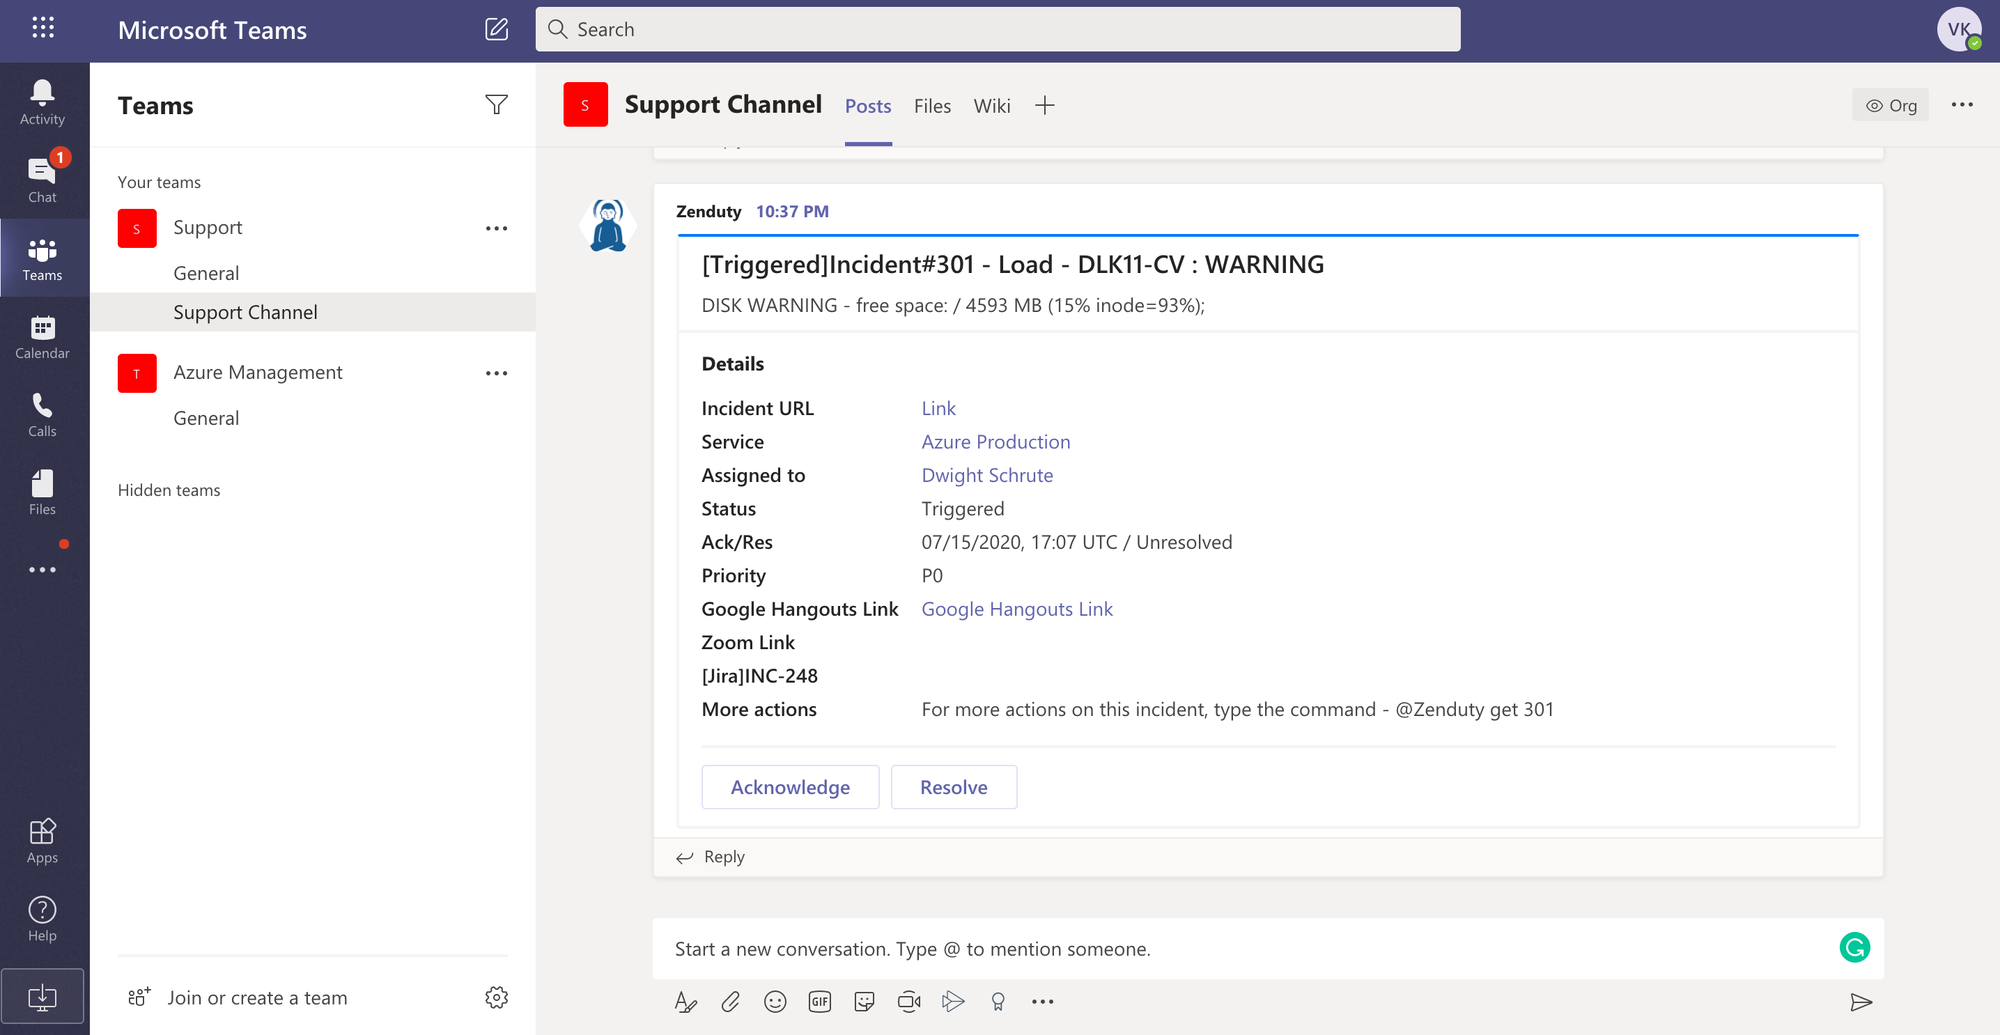
Zenduty’s deep integrations with Slack and Microsoft Teams gives your teams the ability to manage the entire incident within your favorite team communication platforms.