
Major Incident Management with Zenduty, Grafana, Slack and Zendesk
Last updated
In the current fast-paced world, businesses are seeking methods to increase their efficiency and simplify their processes. But, there are times when teams are unaware of an issue at the initial stage, leading to a bad customer experience.
For example, you are a part of the Infrastructure team, where your primary responsibility is to check resources and notify when they reach their maximum capacity.
Let's say due to an anomalous traffic load, our resource CPU utilization goes above 90%. This will lead to latency and eventually a large percentage of our requests timing out. In a situation like this, a rapid incident response is required to quickly mitigate the impact to customers.
Here's when a monitoring and visualization dashboard like Grafana and an incident management platform like Zenduty can help you detect and mitigate these issues even before they impact your customers.
How do we setup our metrics and Grafana alerts?
You can set up a threshold Grafana alert for CPU usage or other black-box or white-box metrics like %5xx or response times, such as whenever CPU usage goes above 90%, an alert is fired. By informing you of the state of the resources, Grafana alerting enables you to maintain control over the situation.
If any critical Grafana metric exceeds a certain threshold, Zenduty will initiate an incident and implement the escalation protocol, notifying the appropriate engineers through their designated communication channels.
To achieve this, all you need is Grafana integration with Zenduty.
How Grafana integration works with Zenduty?
If you are wondering how to integrate Grafana with Zenduty, here are the steps you can follow:
In Zenduty:
- On Zenduty, navigate to Teams and select the team to which you want to add the new Grafana integration.
- Then go to Services and select the required service.
- Select Add New Integration from the Integrations menu. Choose the programme Grafana V8 from the dropdown menu and assign it a name.
- Copy the created Webhook URL by selecting Configure from your integrations.
In Grafana V8:
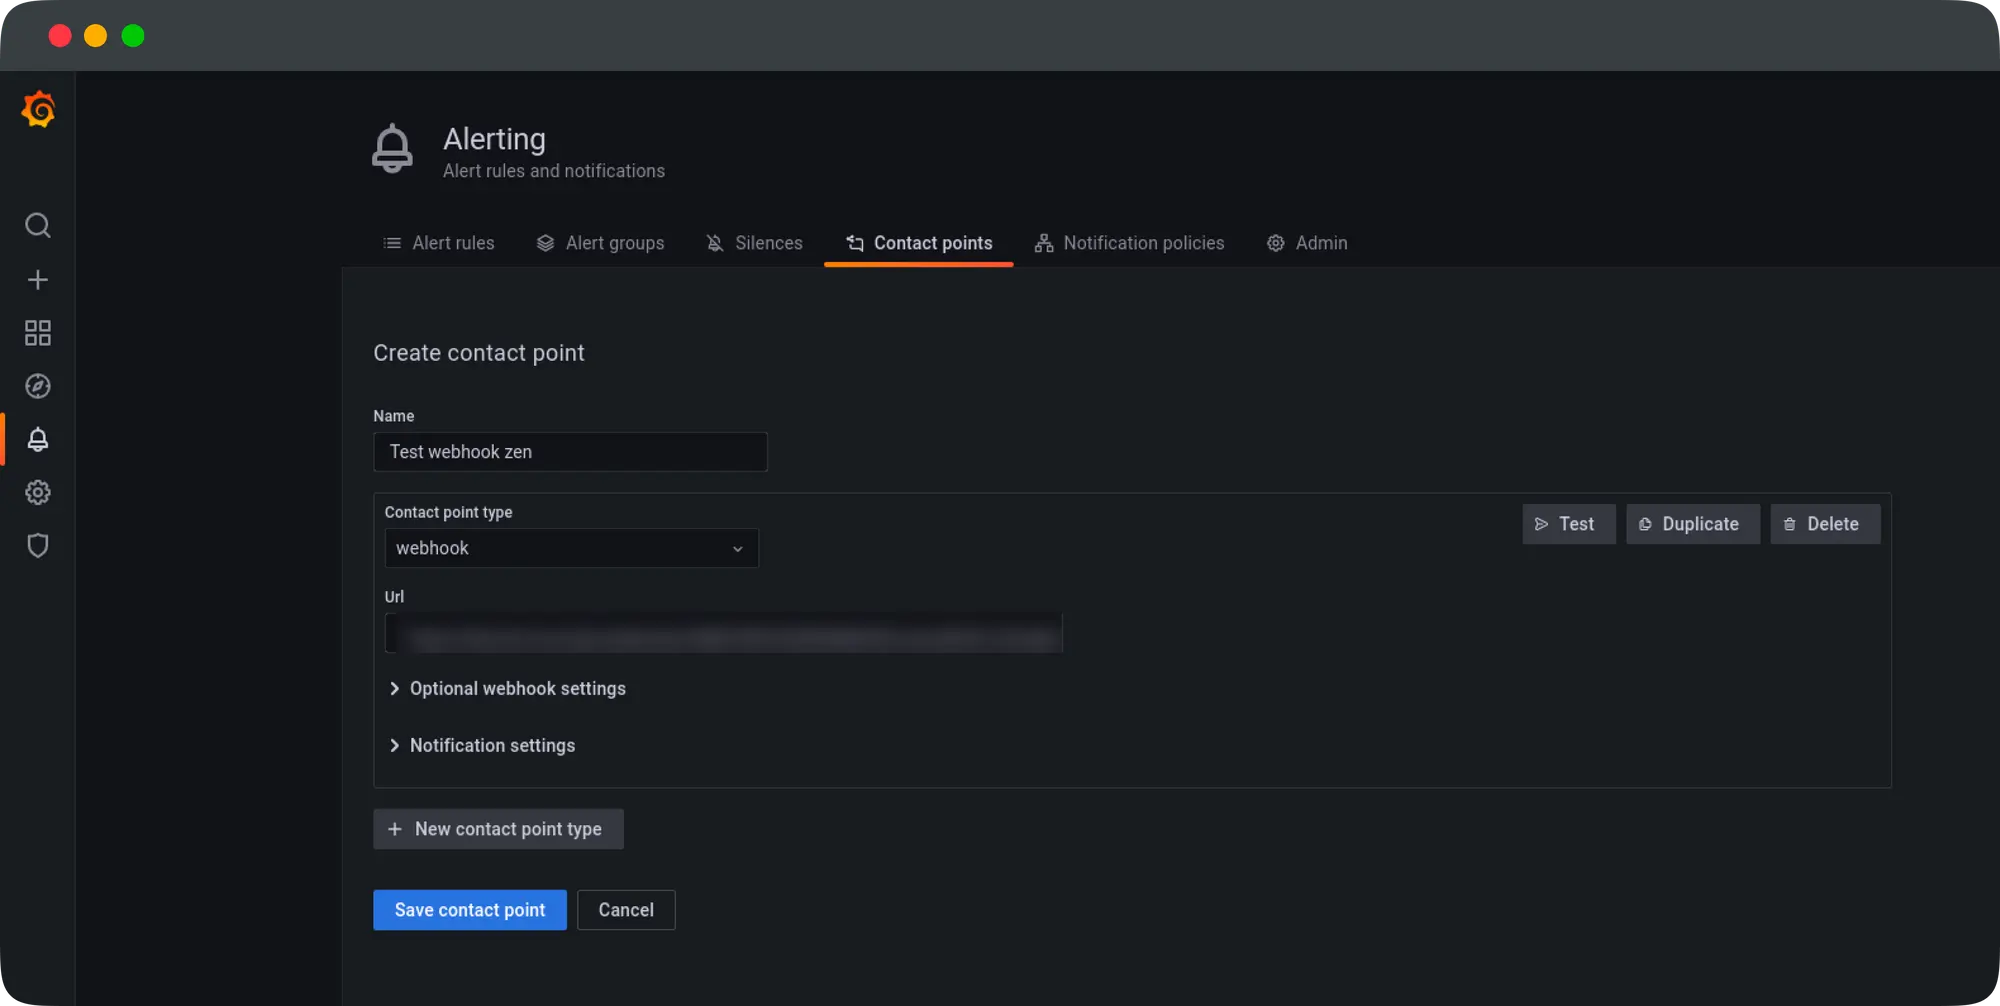
- Log in to Grafana. Head over to Contact Points. Add a new contact point and choose Webhook as the contact point type.
- Insert the webhook URL you copied from Zenduty. Copy the Webhook URL, paste it, and then select Save.
Go to your Grafana Dashboard and access the Alerting tab. Select Create alert. Add Zenduty as a notification option under Send to in the alert setup. Save the graph after adding a pertinent statement to the alert.
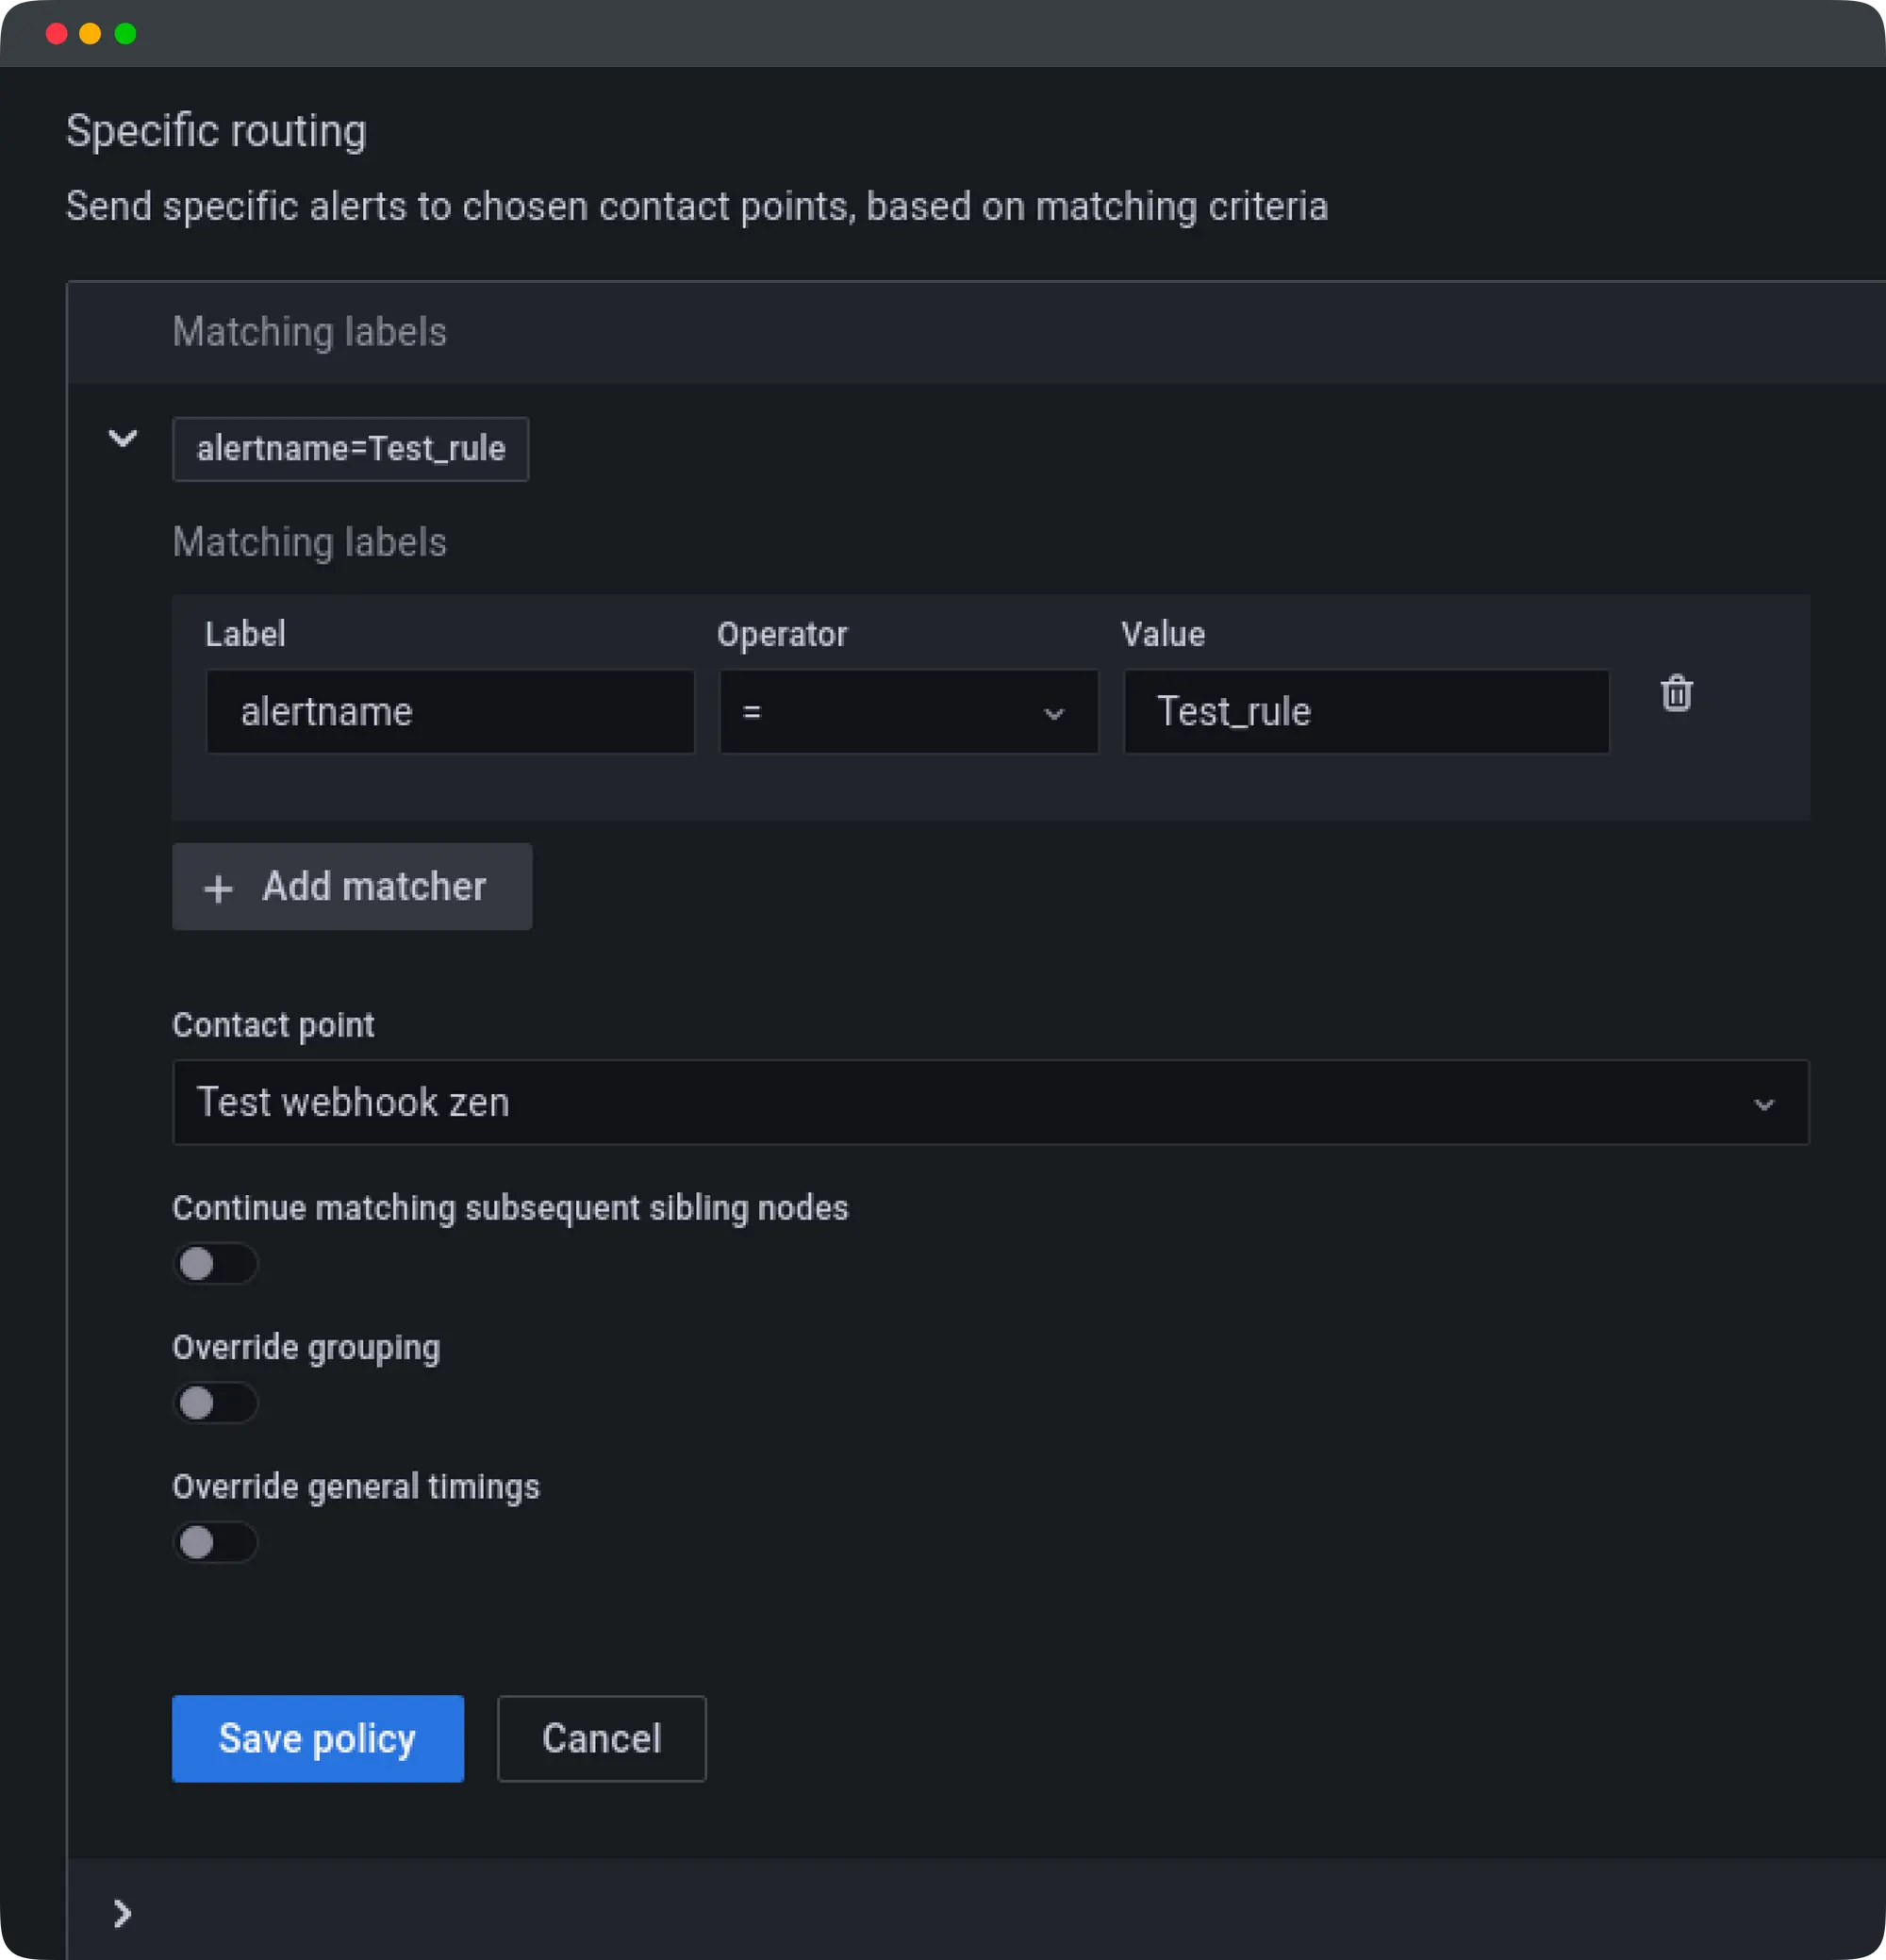
This ends the Grafana integration process with Zenduty. Now, Zenduty will create incidents automatically whenever Grafana alerts are created.
But now the question is how are incidents escalated to Slack.
How does Zenduty escalates incidents to Slack?
For this, you need to set up your notification rules to include your Slack handle and specify when you wish to receive alerts on Slack.
Slack Integration with Zenduty
With Slack integration, you can ask Zenduty to alert you using the "send notification personally" option whenever an incident is assigned to you. Notifications sent through phone call or SMS can be replaced with this or used in addition to it.
To achieve this, "Connect your Slack account."
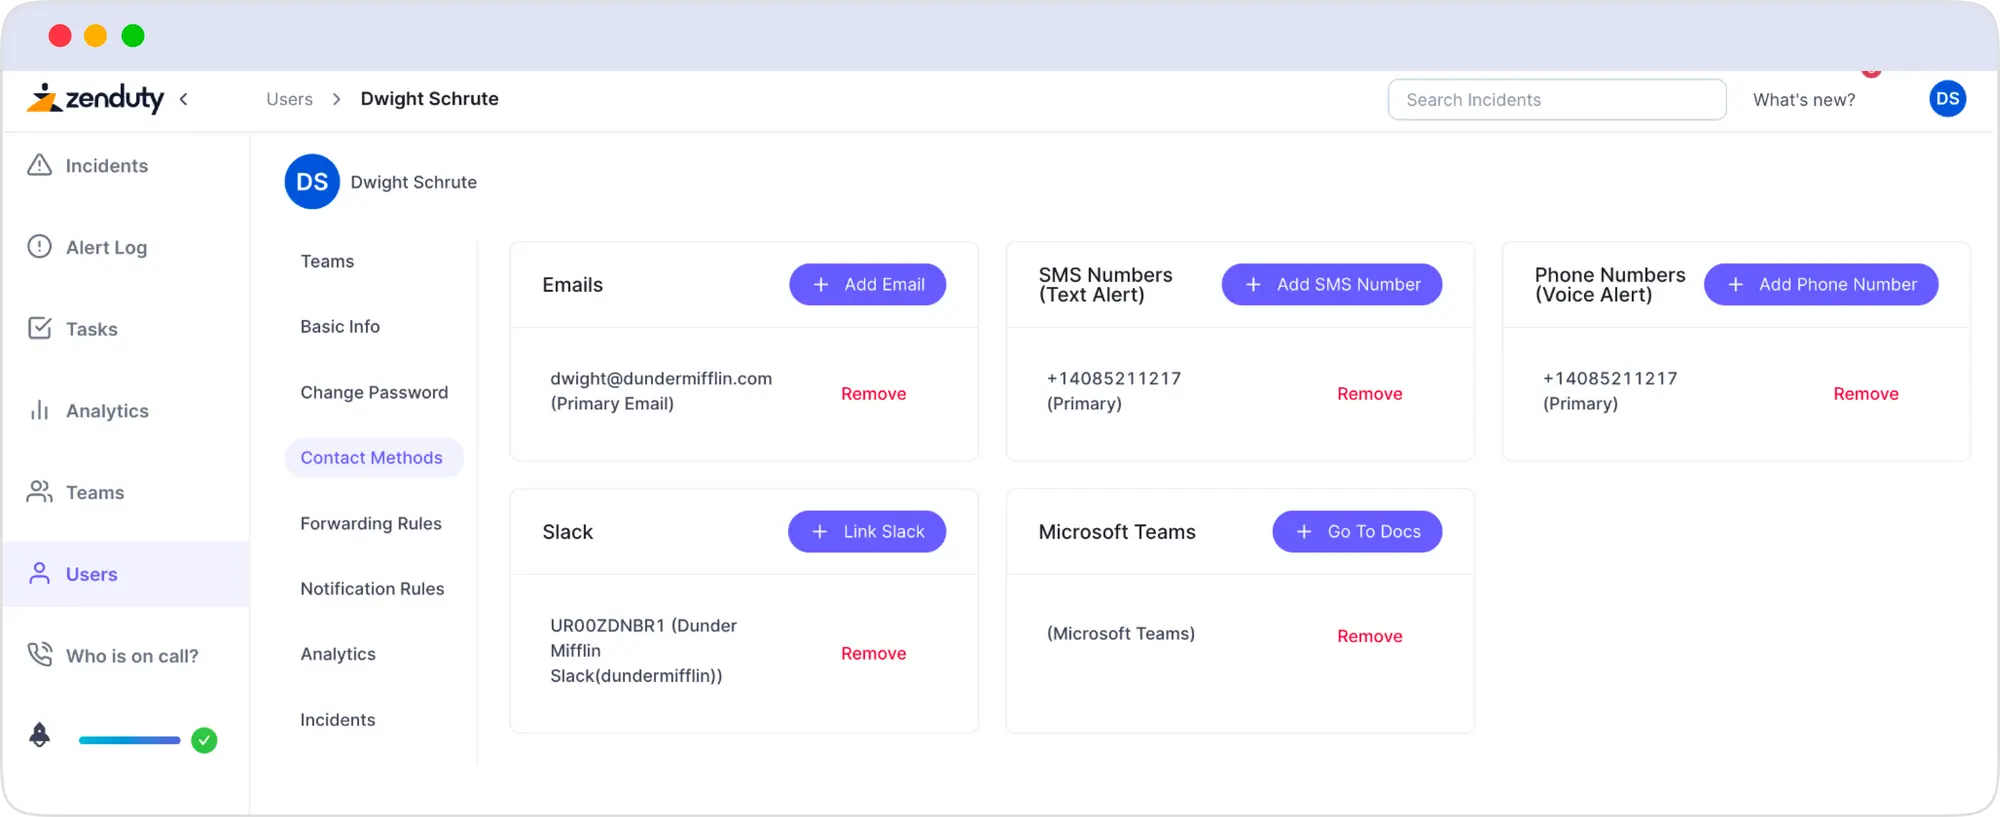
After completing this, add Slack in your notification rules.
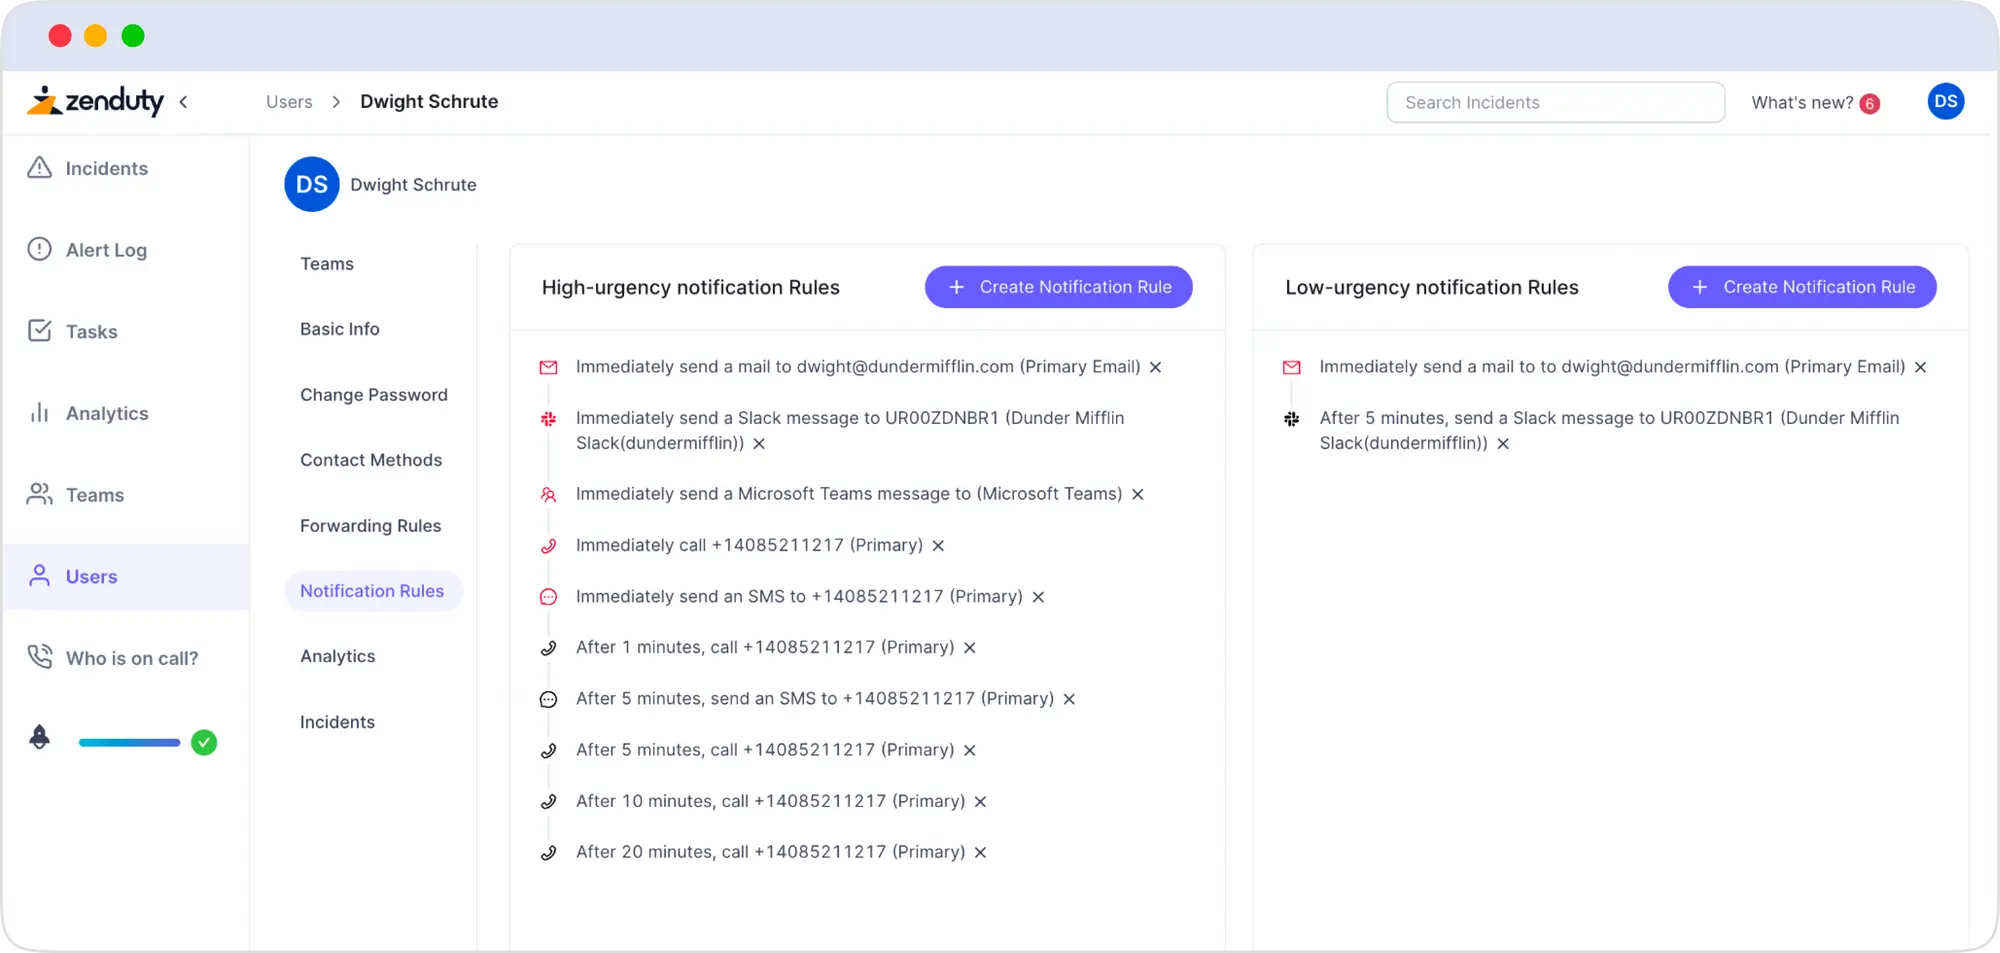
Once configured, Slack will automatically get all Zenduty alerts.
According to the notification rules you set up, you will receive personal messages from alerts about incidents that have been allocated to you.
Then, within Slack, you may acknowledge, address, or assign Zenduty incidents.
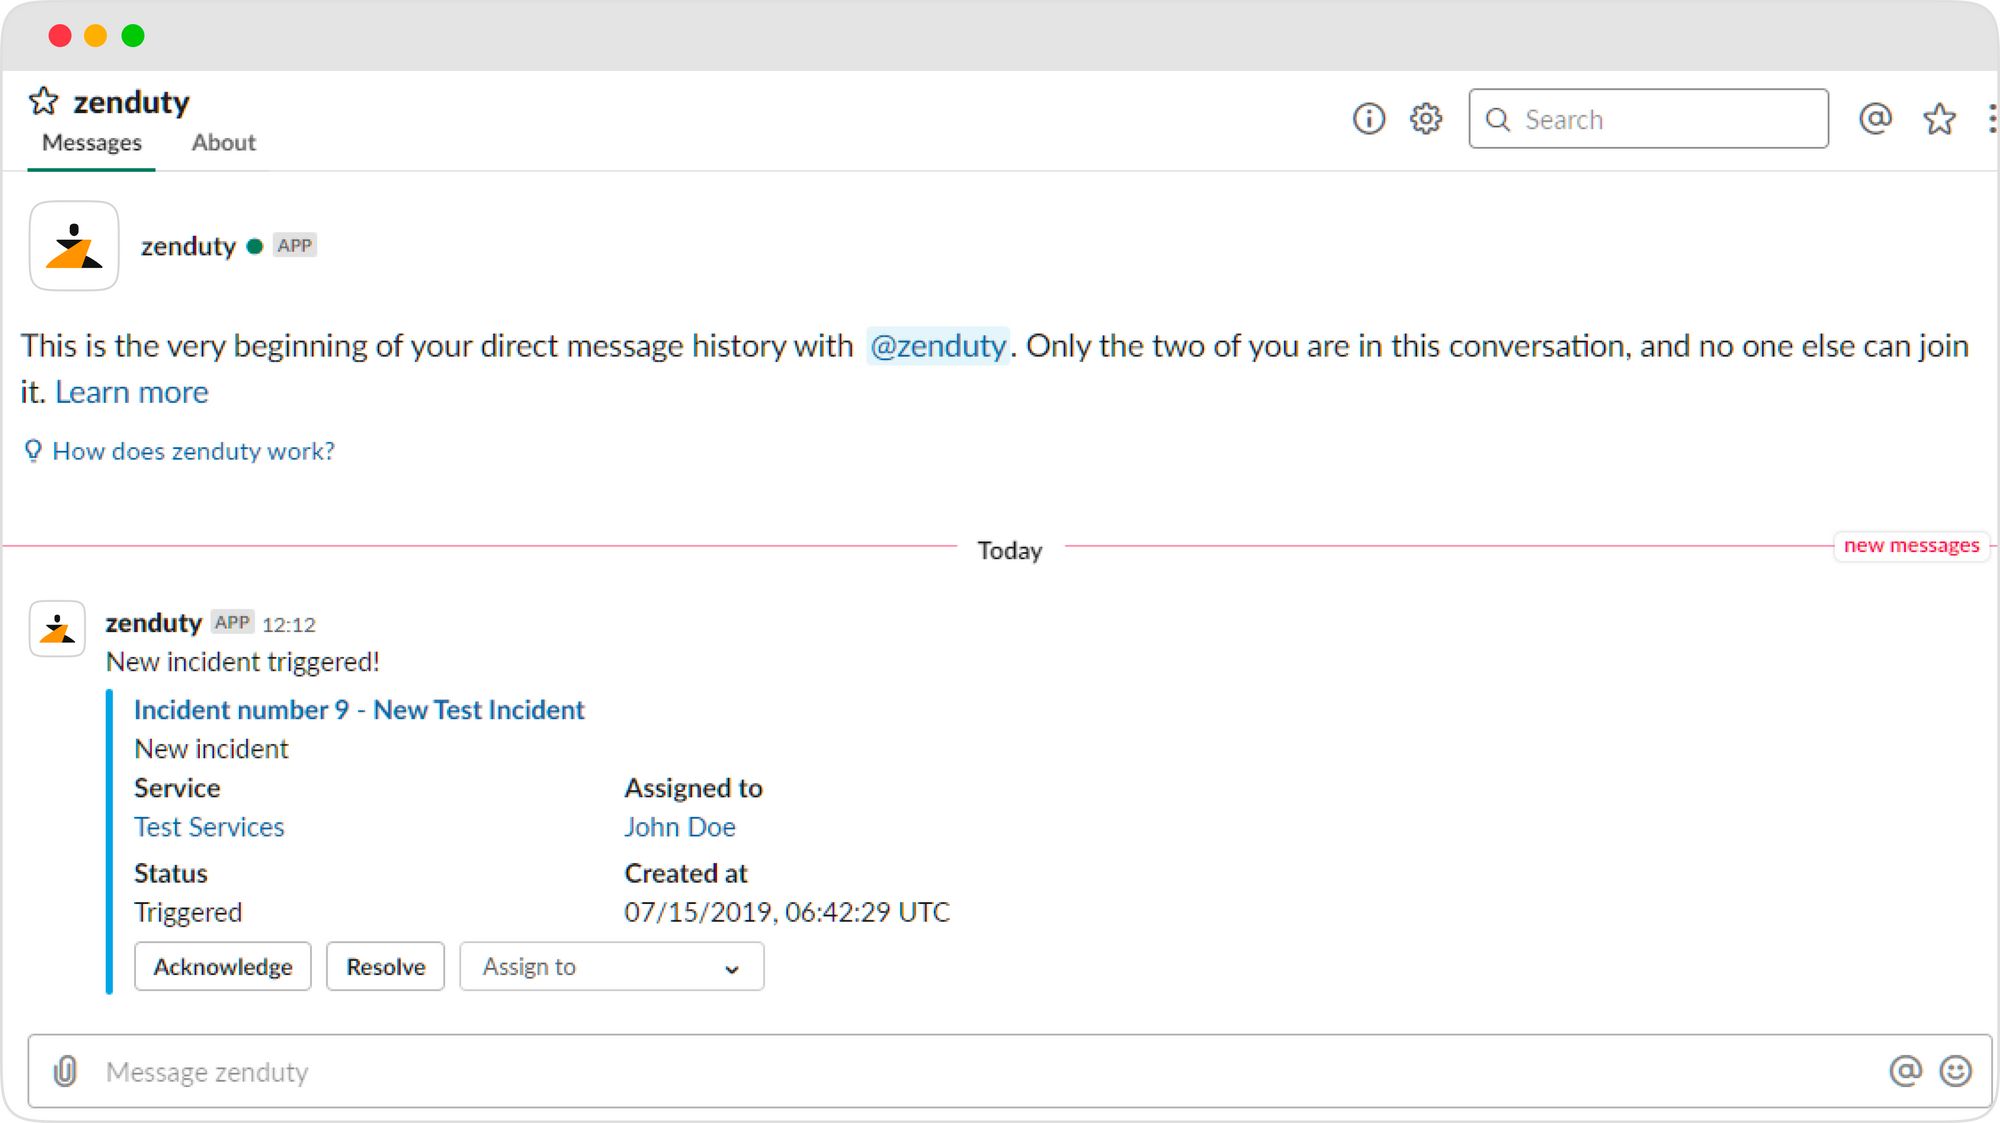
The Slack channel will get all notifications regarding a service that has been integrated with it. The incident can then be acknowledged, resolved, or assigned within Slack by any team member.
What happens when an incident is assigned through Slack?
Once the incident is assigned to the concerned person on Slack, a bunch of action buttons are available.
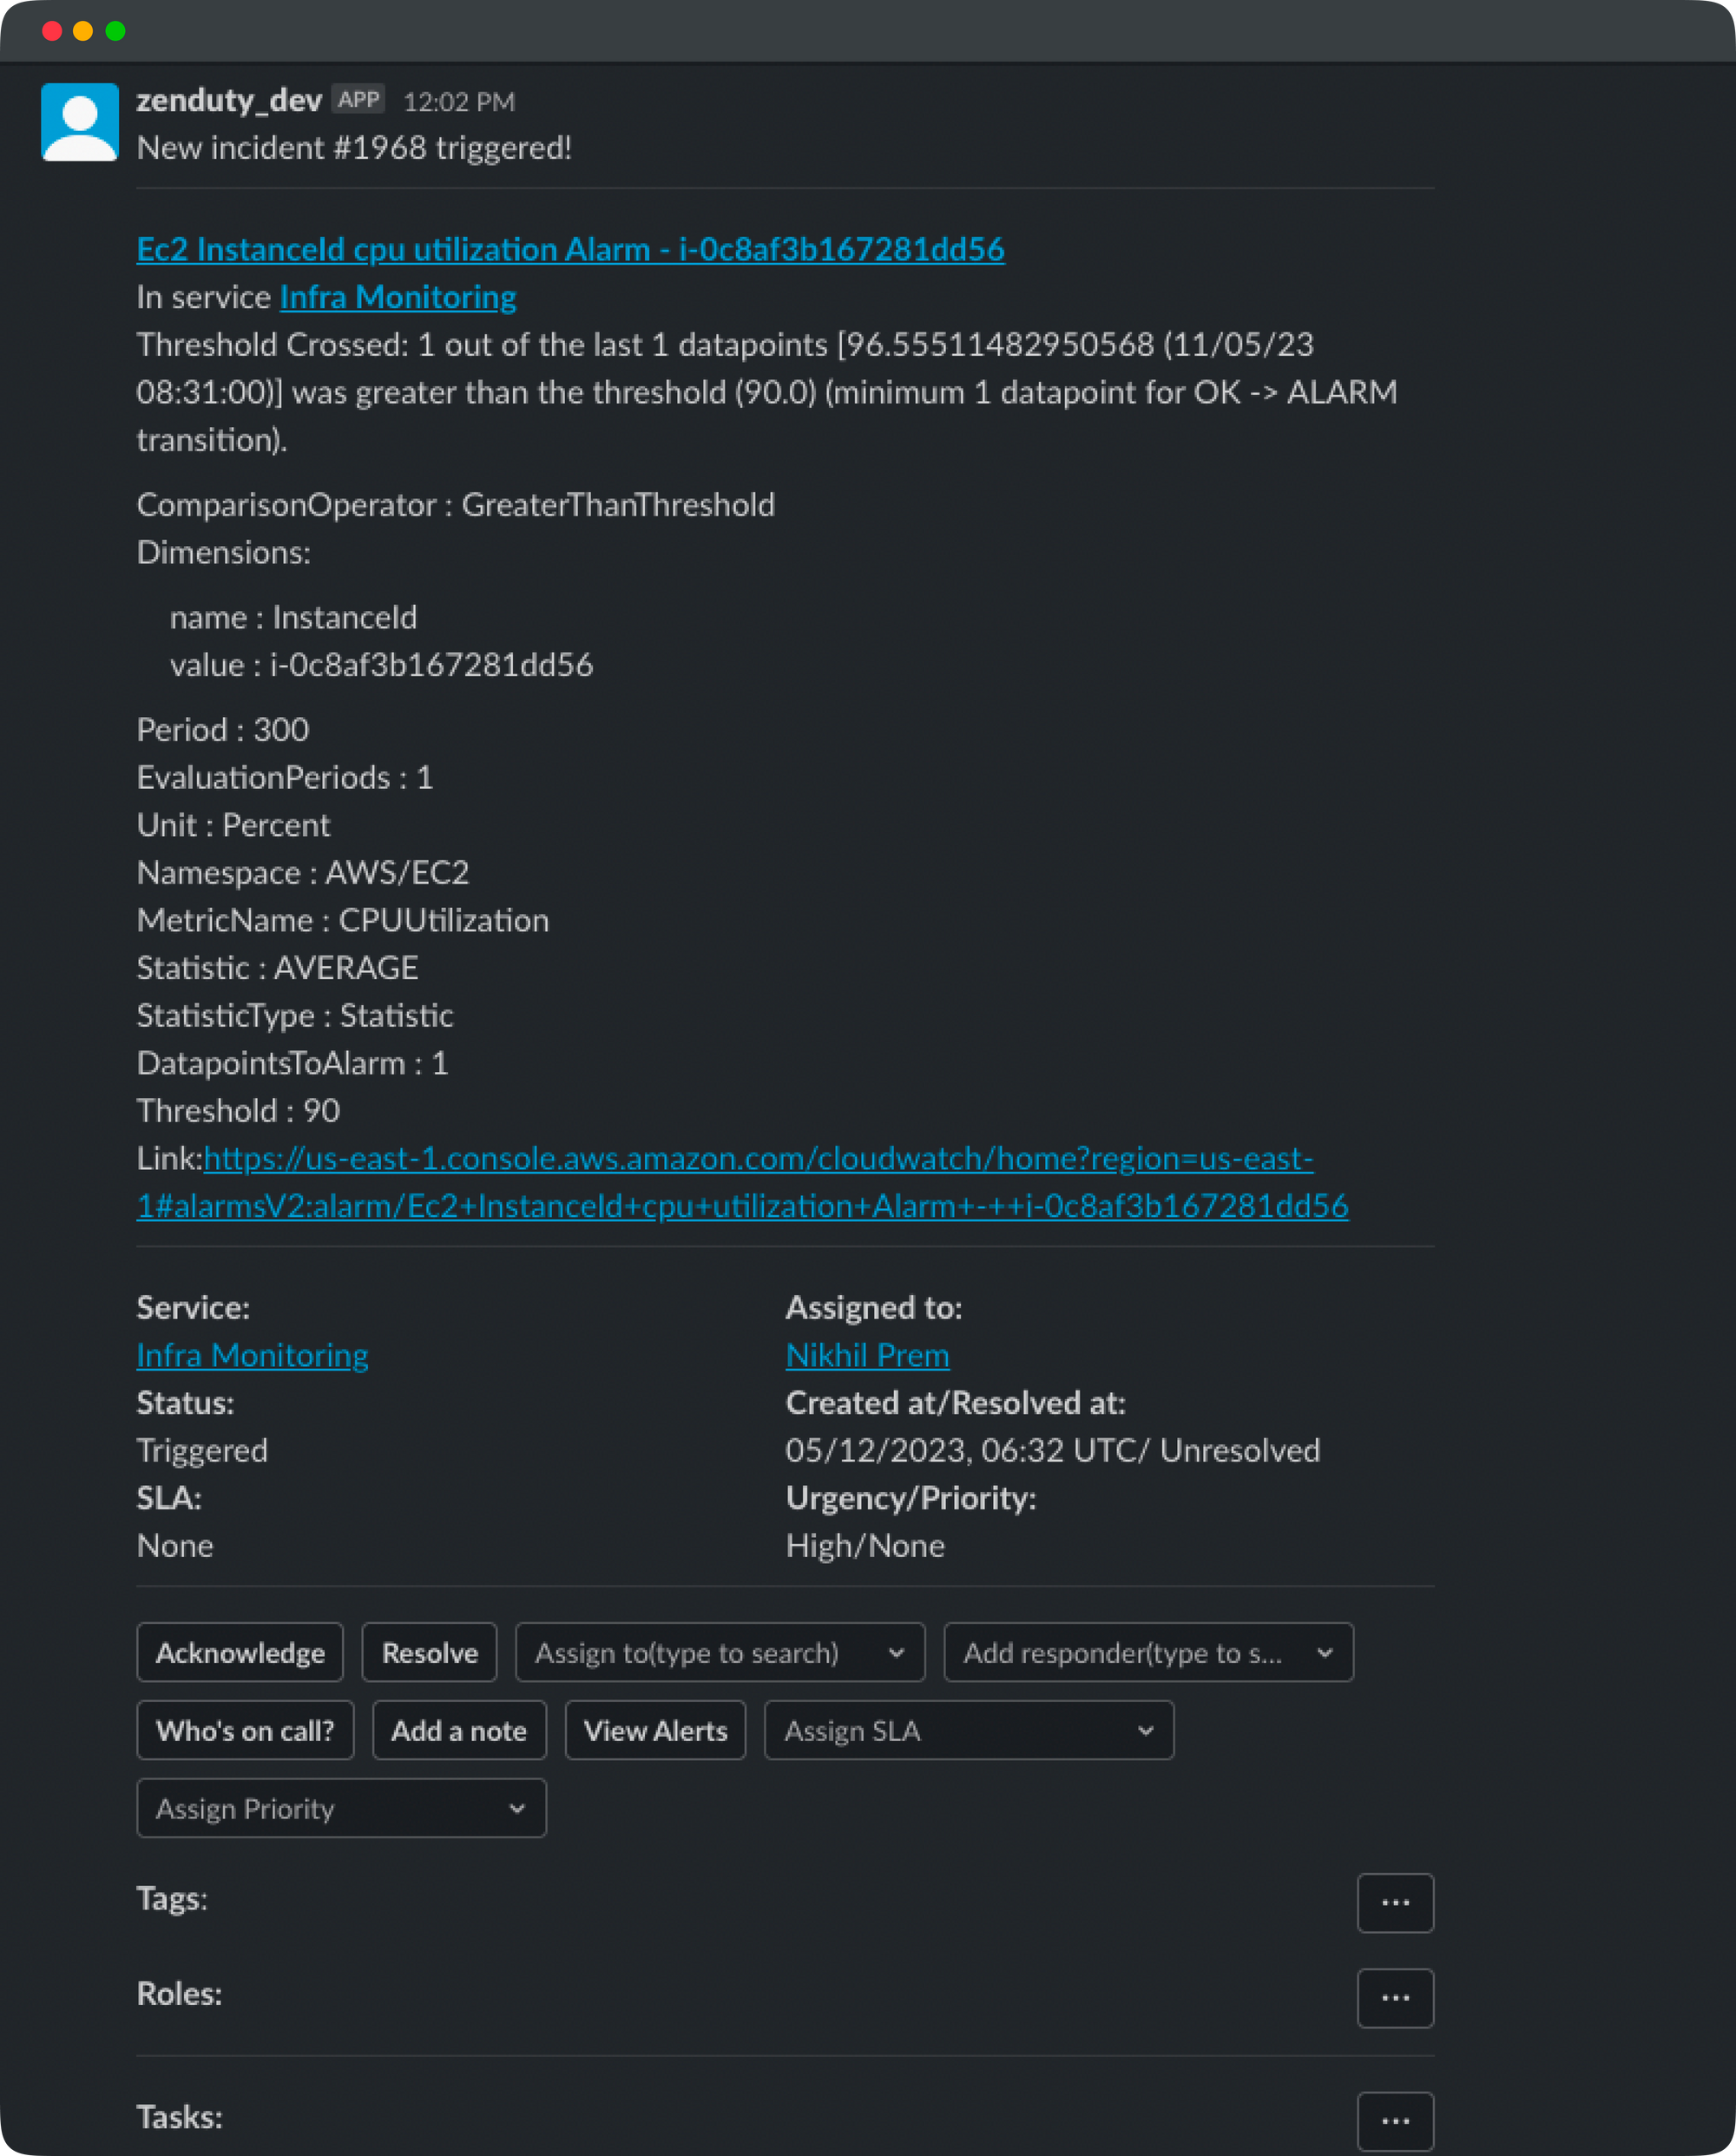

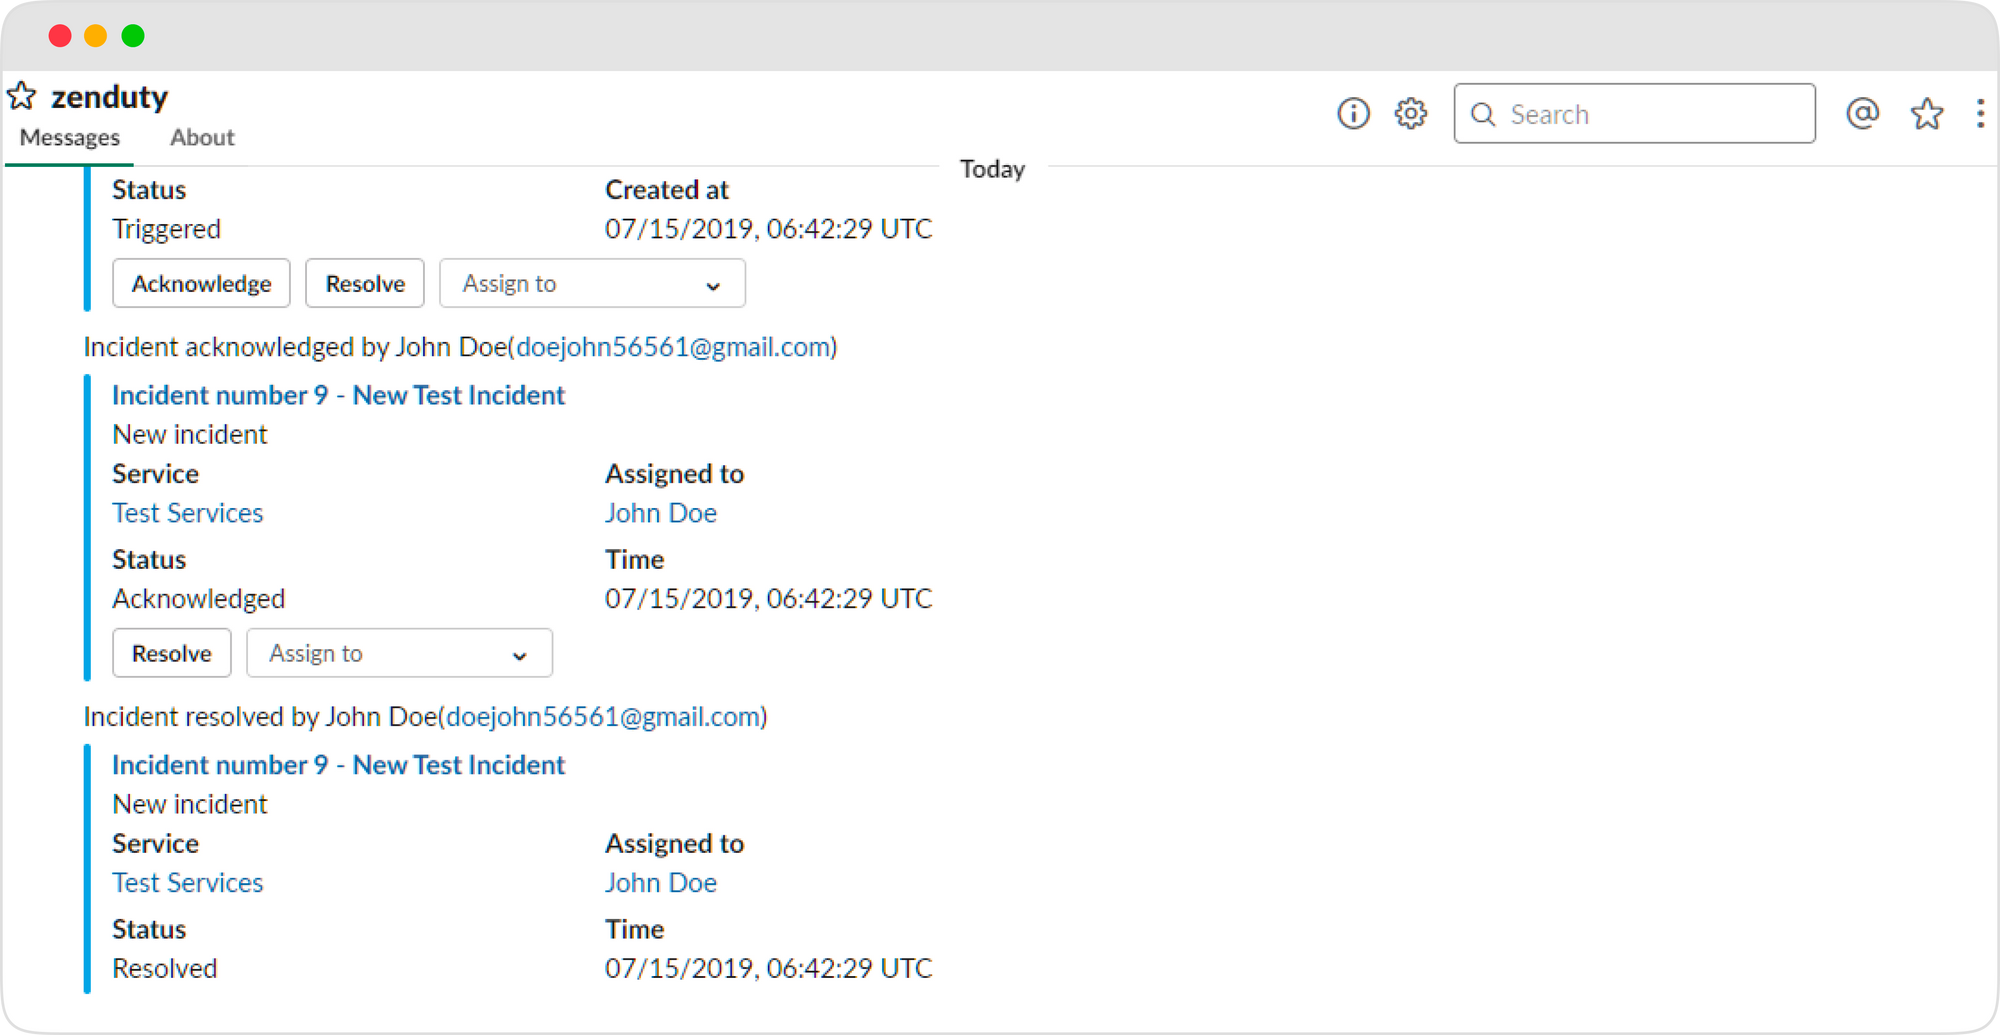
After clicking “Resolve” on Slack, a request will be sent to Zenduty, and the incident will be auto-resolved. Furthermore, Zenduty automatically resolves the issue when Grafana notifies the user that everything is back to normal, in our instance, when the CPU usage is below 80%.
This ends the Grafana Slack integration process with Zenduty. Now, whenever Grafana alerts are fired, Zenduty will create an incident and send you a notification on Slack.
But what happens if the customer reports the issue before your monitoring tools do?
This is a very real scenario if you set higher thresholds or longer evaluation time for your key metrics. In such a situation, if customers detect a downtime, they are likely to highlight the issues through a ticketing tool such as Zendesk. Zendesk allows users to create a ticket and explain the application issue. But, to resolve the issue, you need to connect to Zendesk, analyze and resolve the issue.
Zenduty streamlines the process of accessing multiple platforms by offering a centralized platform that enables integration with various tools you are currently utilizing. This simplifies the task of switching between applications and minimizes the possibility of confusion resulting from the need to remember and work with distinct applications. Ultimately, this saves time and enhances productivity.
All you need is to integrate Zendesk with Zenduty, and everything related to incident management remains the same.
How Zendesk Integration works with Zenduty?
With Zendesk integration, Zenduty can notify the appropriate teams of new Zendesk ticket alerts based on their on-call schedules via email, SMS, Voice, Slack, Microsoft Teams, and push notifications for iOS and Android. Zenduty keeps on escalating alerts until they are acknowledged or closed.
Here’s how their integration works:
To integrate Zendesk with Zenduty, here are the steps you can follow:
In Zenduty:
- Go to Teams on Zenduty and select the team you wish to add the new Zendesk integration to.
- Go to Services and select the required service.
- Select Add New Integration from the Integrations menu. Choose Zendesk from the dropdown menu and assign it a name.
- Copy the generated Webhook URL by going to Configure under your Integrations.
In Zendesk:
- Go to Admin Settings -> Apps and Integrations and open Webhooks after logging into Zendesk.
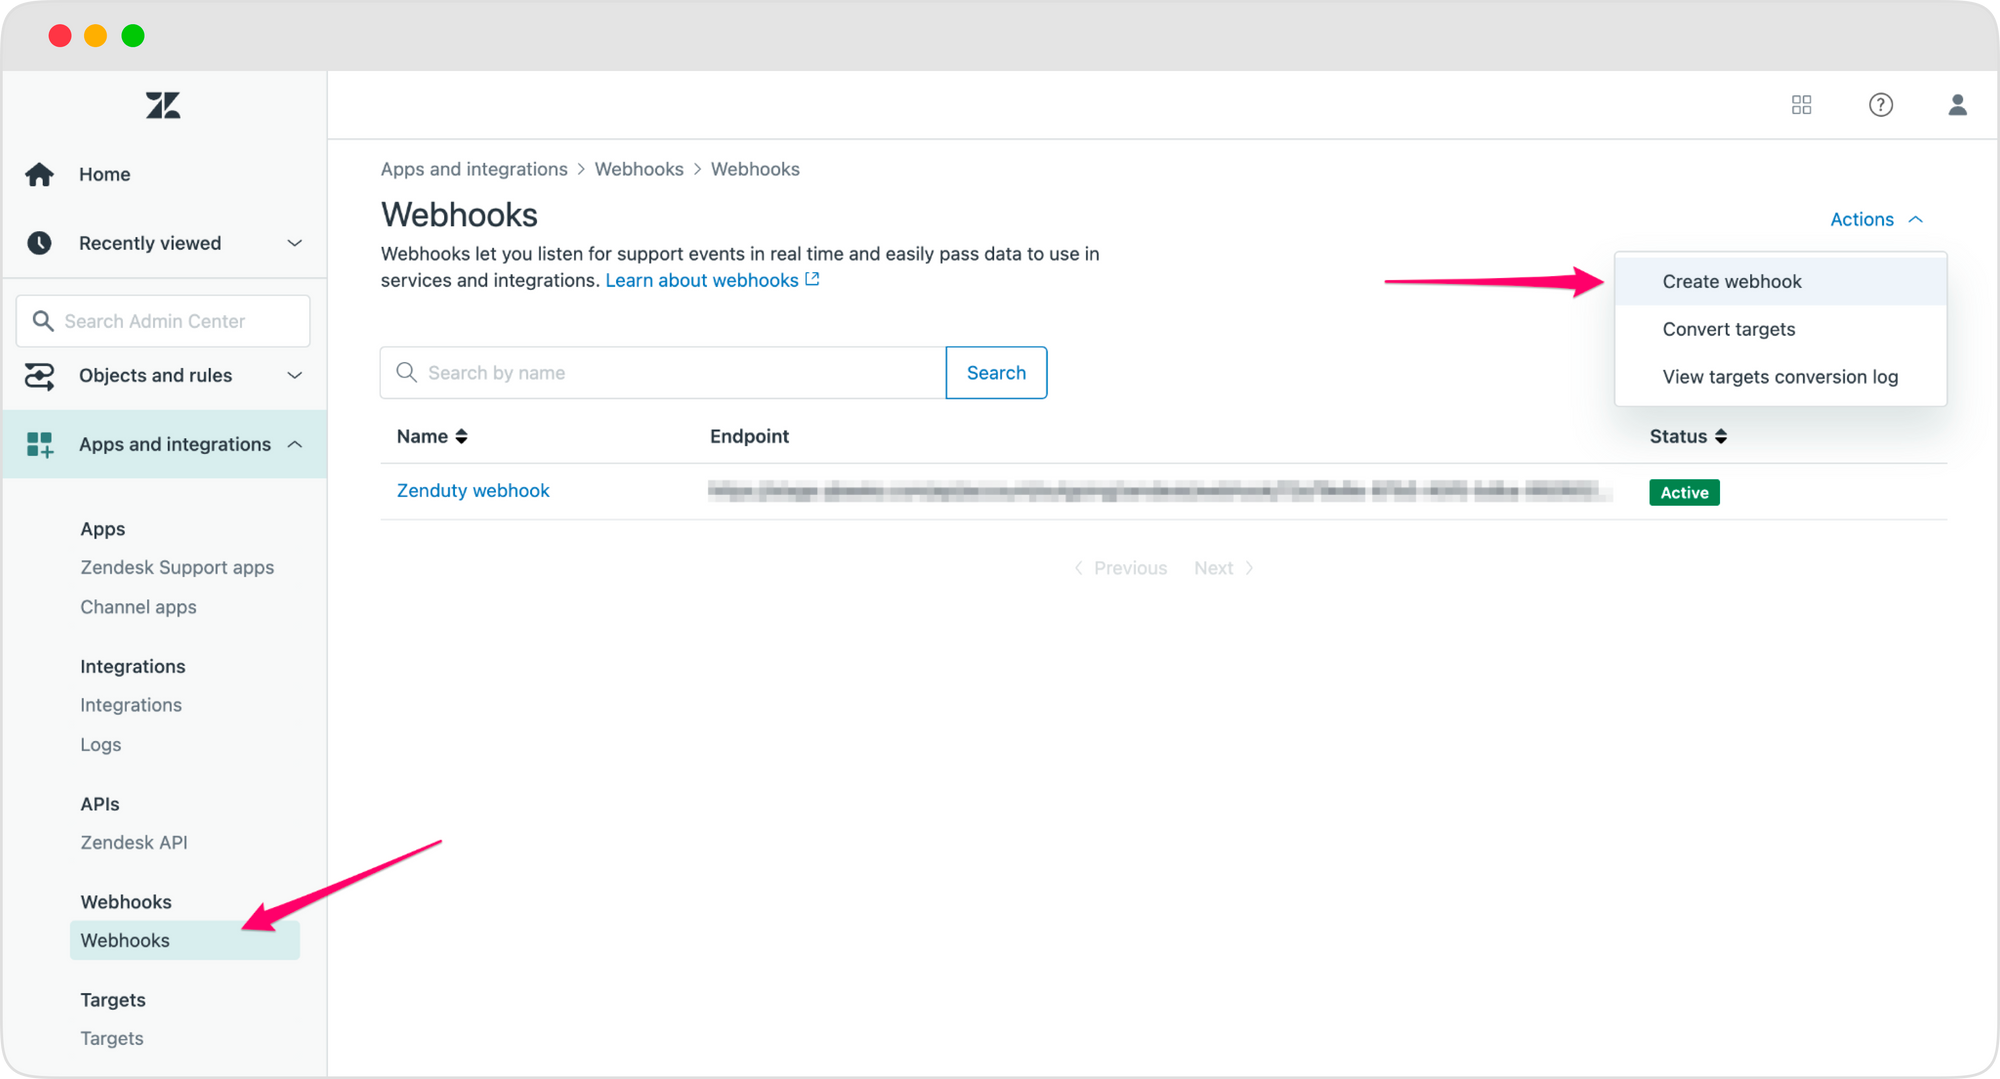
- Just click on Create Webhook. Complete the form as outlined below. Copy the webhooks url and paste it into the url area.
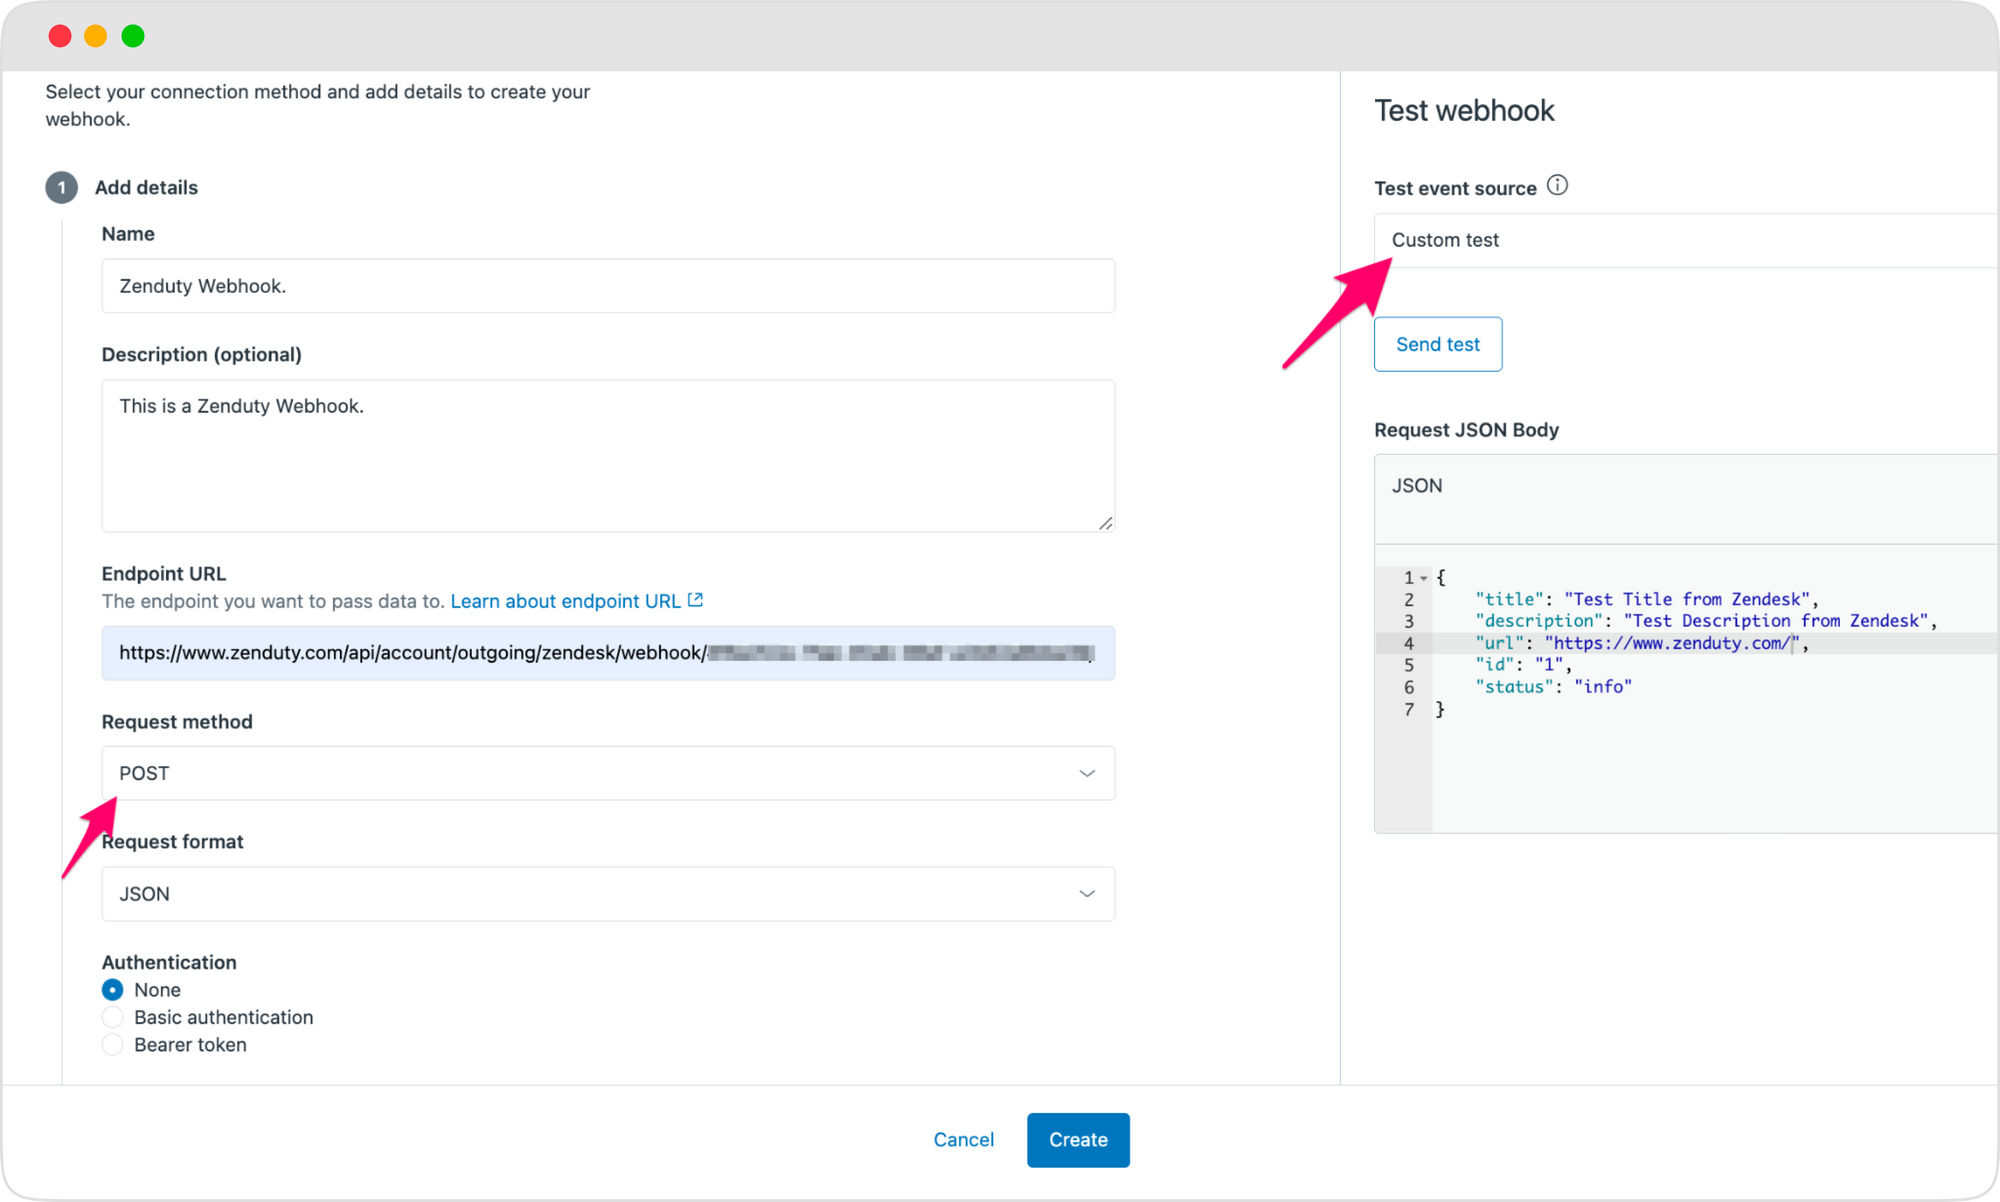
Note: Make sure the method is set to POST.
- To test the webhook, choose Custom Test from the Test event source drop-down menu and provide the request JSON body as follows:
If Zendesk sent you an Info alert, the webhook connection was successful.
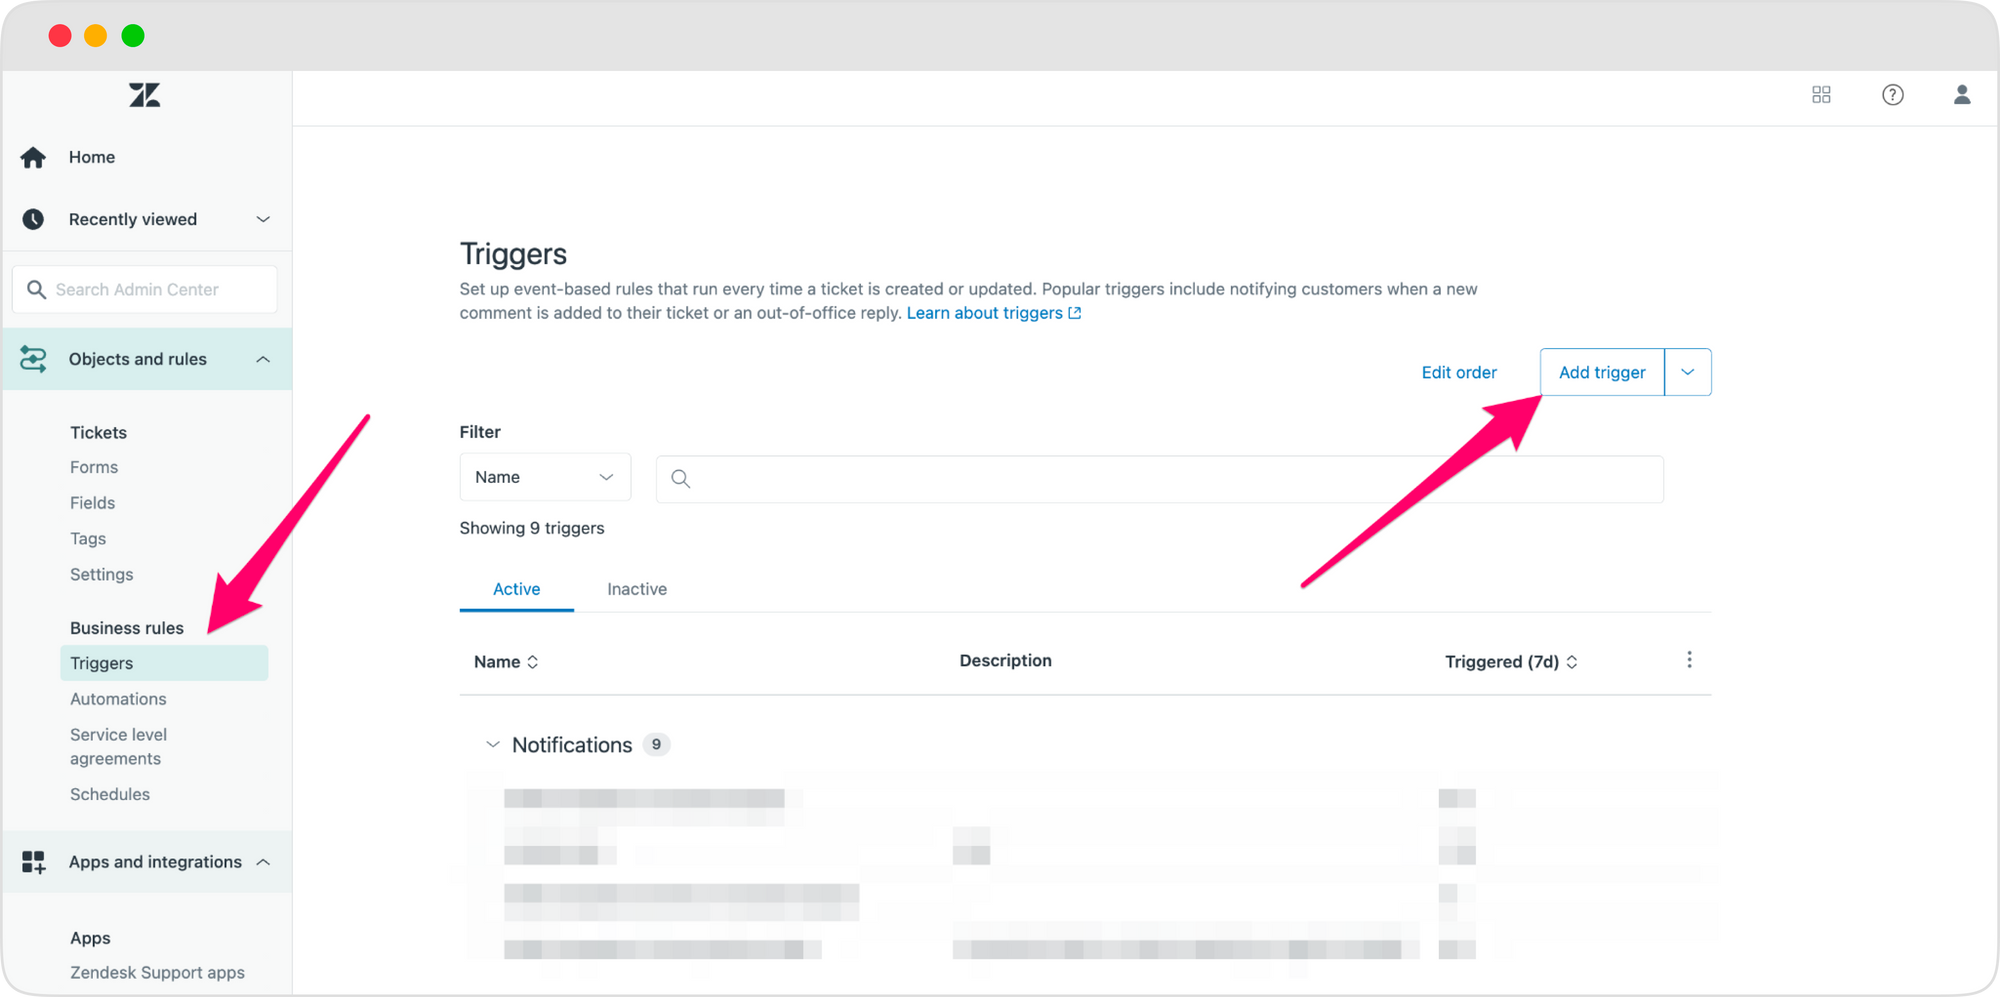
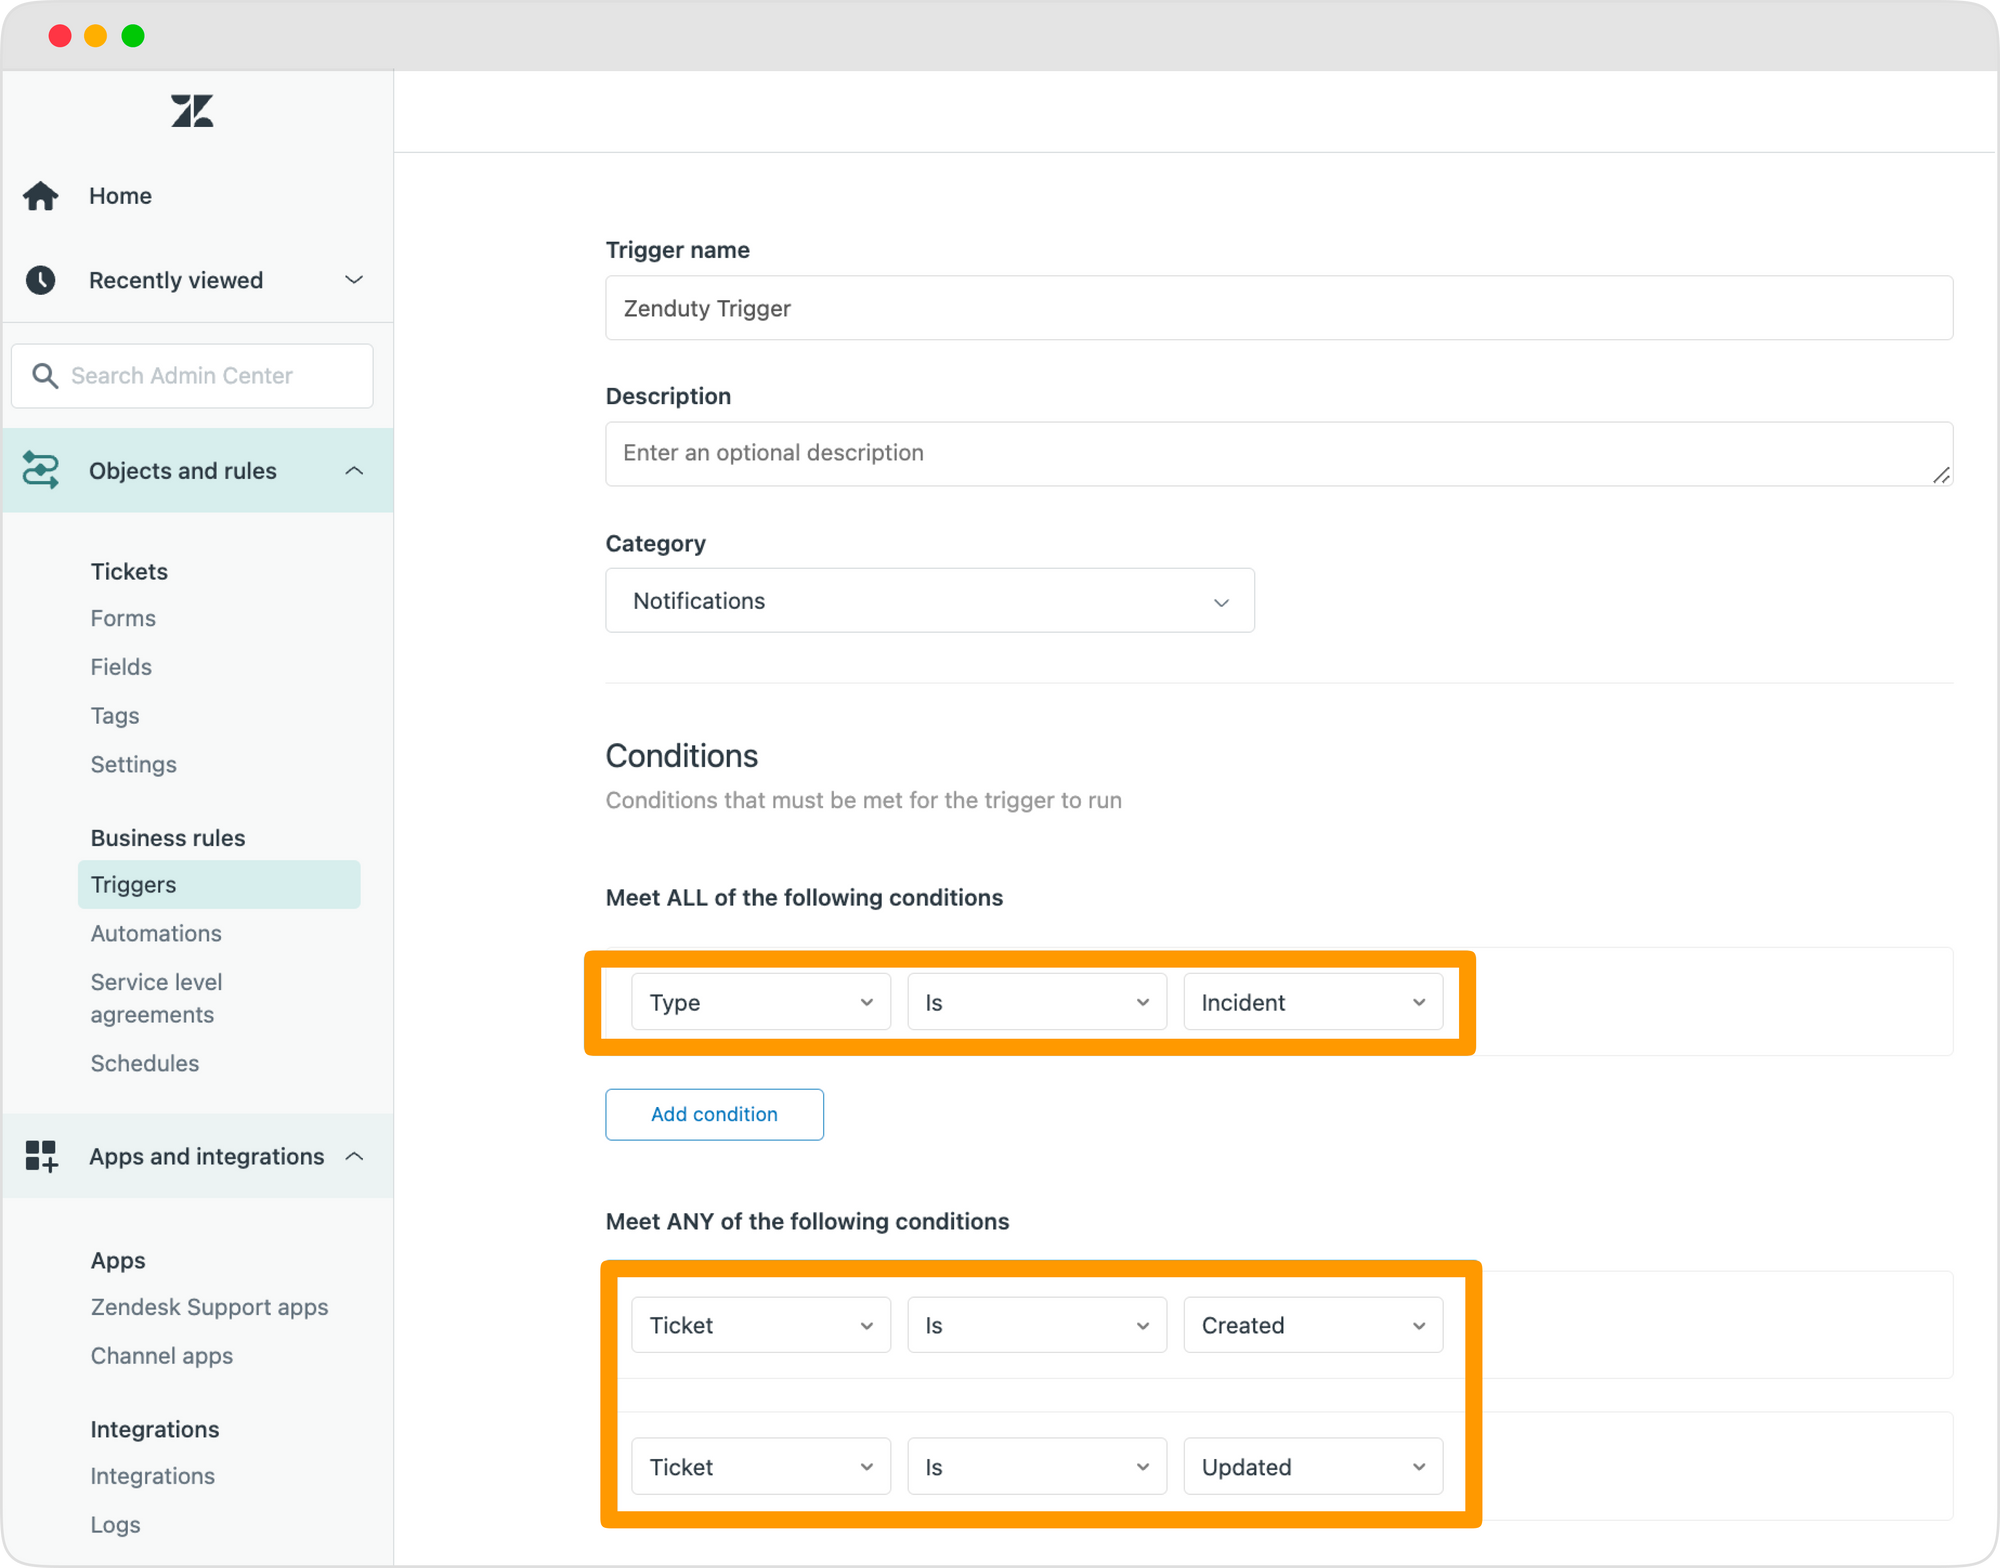
- Get started by accessing Zendesk -> Admin Settings -> Objects and rules -> Business Rules -> Triggers.
- Go to Add Trigger. Name the trigger "Zenduty trigger"
- Under Meet ALL of the conditions,Select Type is Incident or another option in accordance with your needs.
- Add the two requirements Ticket is Created and Ticket is Updated under Meet ANY of the following conditions.
- Go to the Actions tab, choose Notify active webhook and then choose the webhook you generated earlier.
- For the JSON body, paste the following JSON:
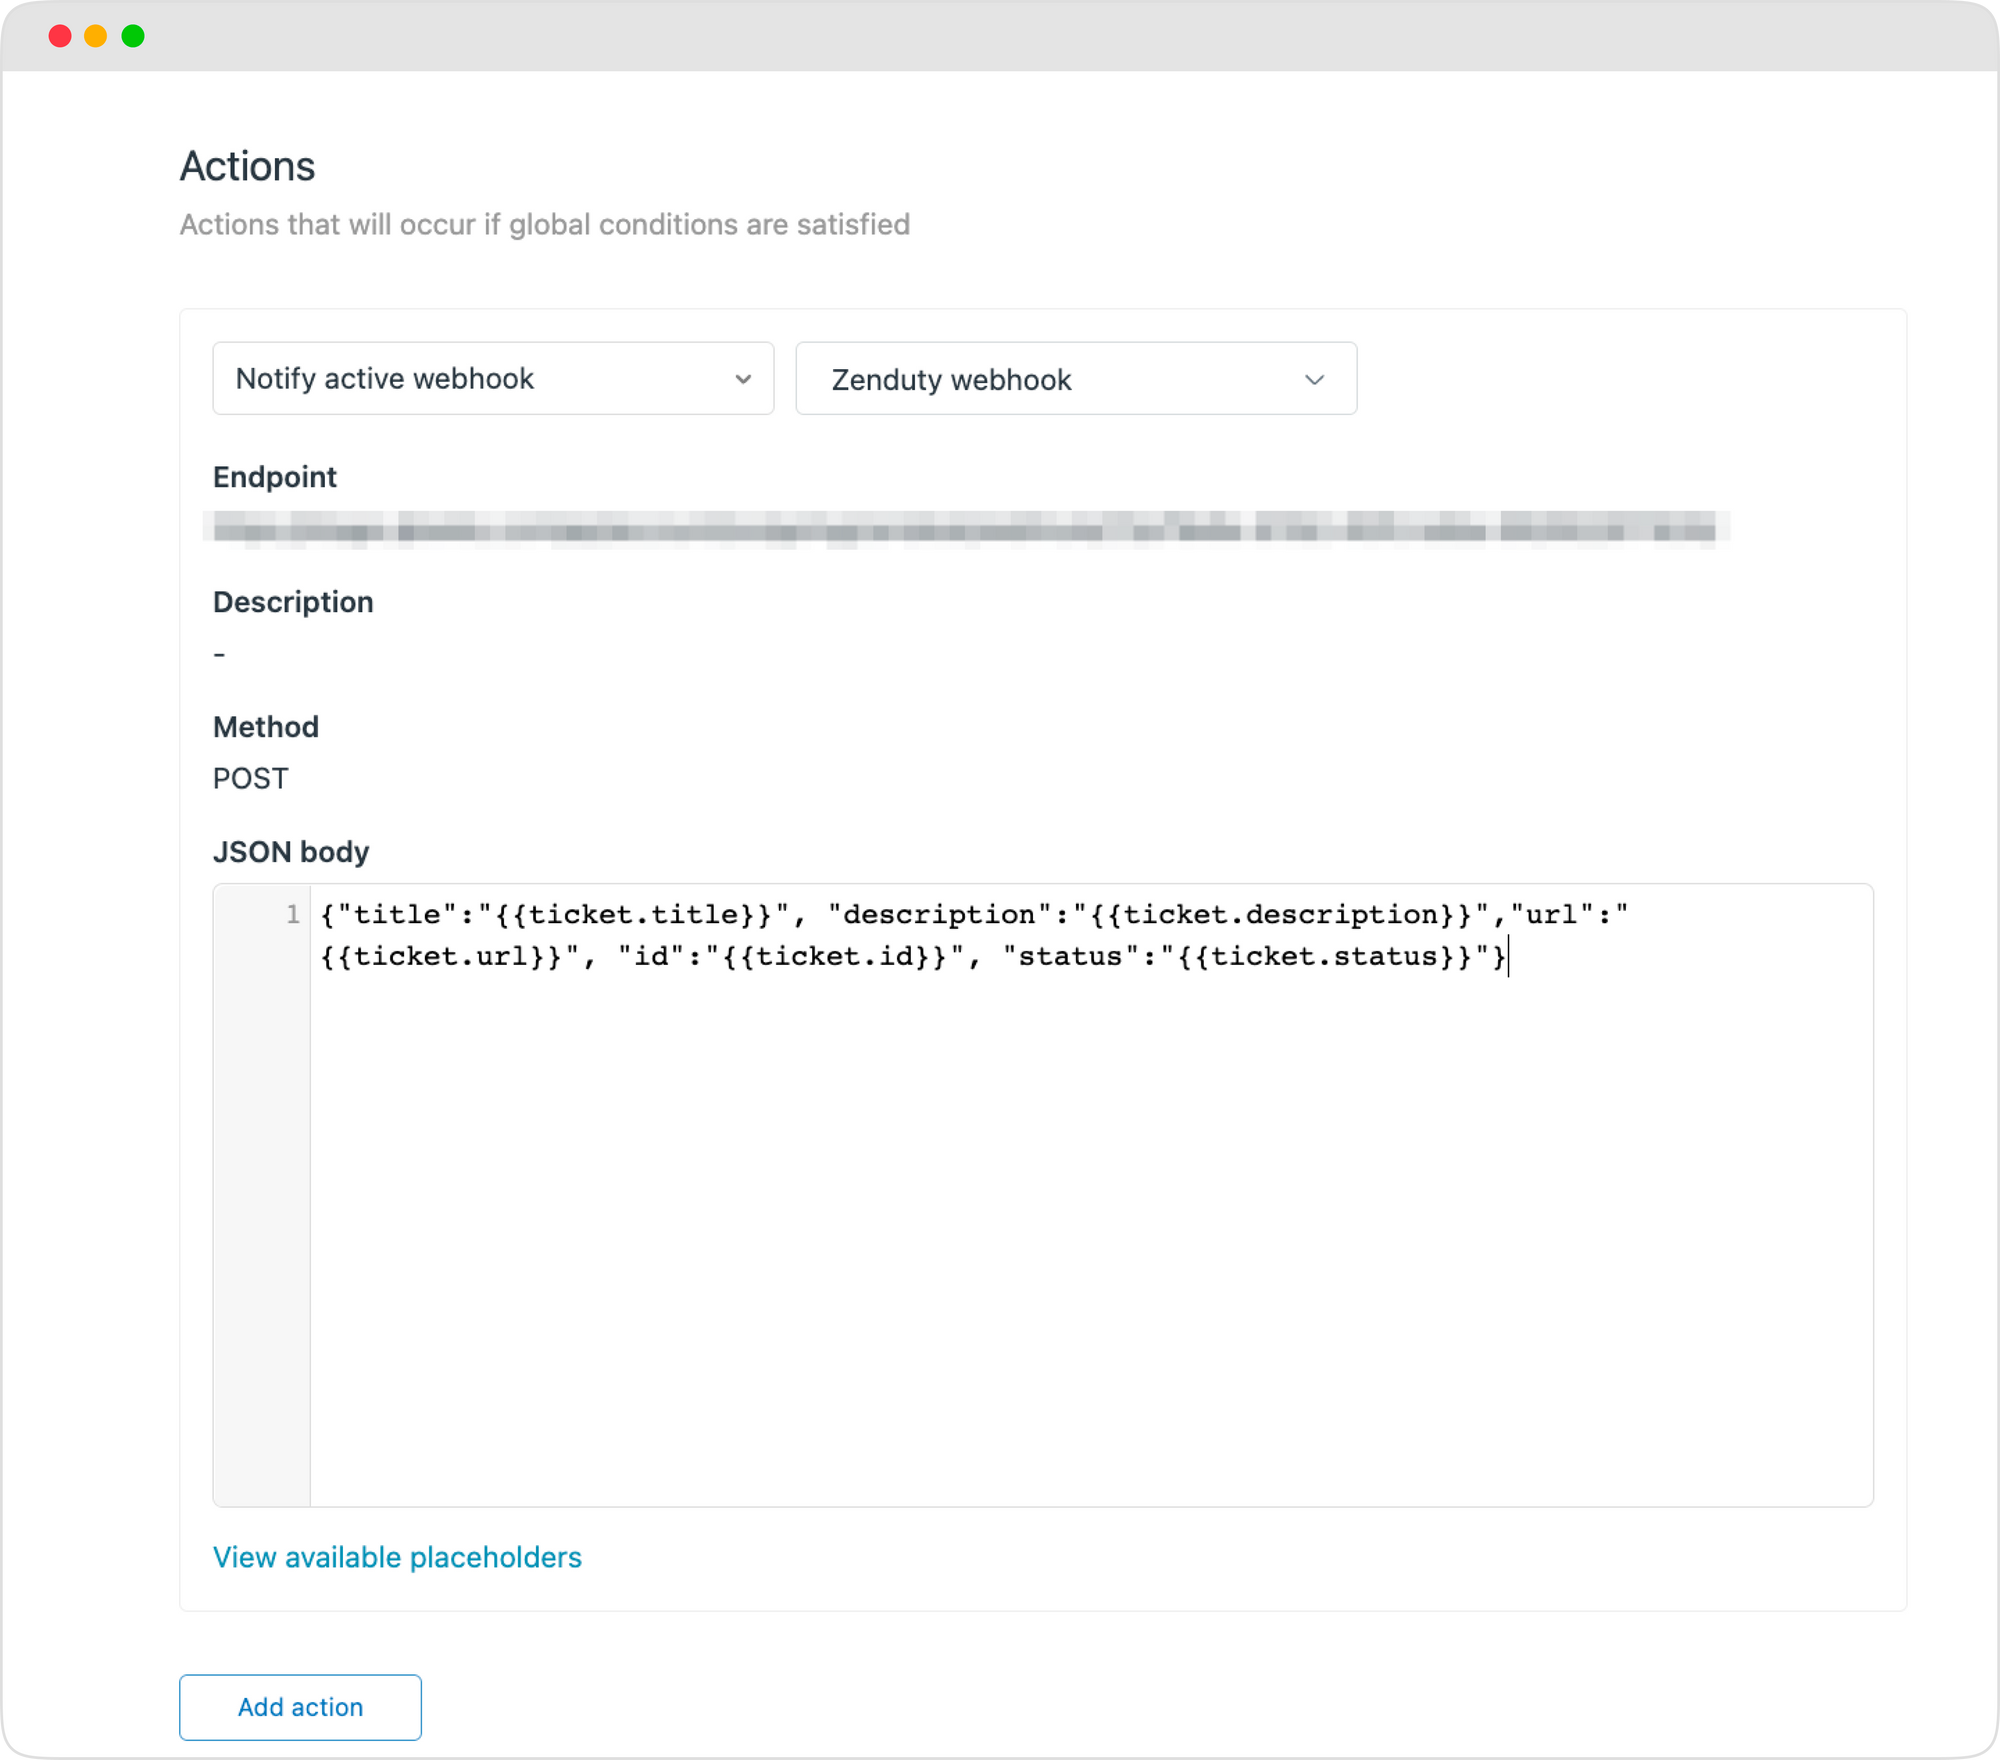
- Click on Save. Zendesk integration is successful. For each new ticket created on Zendesk, Zenduty will start generating an incident.
This ends the Zendesk Slack integration with Zenduty. Since you have already set up notification rules for Slack, Zenduty will notify you when an incident is created.
In conclusion, Grafana Slack integration or Zendesk Slack integration with Zenduty enables midsize teams to quickly identify and resolve issues, reducing downtime and improving customer satisfaction.
Most of our clients have experienced 70-80% drop in the initial response time and 50-60% drop in average resolution time. If you are curious how Zenduty enhances the incident management lifecycle, Start your 14-day free trial today.

Anjali Udasi
As a technical writer, I love simplifying technical terms and write on latest technologies.
