
What is Prometheus Alertmanager?

Last updated
Prometheus Alertmanager is a powerful tool designed to handle various alerts generated by Prometheus. It plays a vital role in the overall monitoring ecosystem, acting as a centralized hub for managing alert notifications.
With Prometheus Alertmanager and its robust notification management capabilities, you can efficiently define alert routing and notification policies. This empowers you to take timely actions and mitigate potential issues before they impact your service availability.
Key Features of Prometheus Alertmanager
The Prometheus Alertmanager offers several essential features that enhance your incident management workflow.
Let's dive deeper into some of these features:
Powerful Alert Routing:
With the Alertmanager, you can define flexible routing rules based on the alert severity or specific criteria. This ensures that alerts reach the right team or individual for prompt actions.
For example, you can set up routing rules to send critical alerts directly to your on-call team, while less severe alerts can be routed to the respective development teams.
Flexible Notification Options:
The Alertmanager supports various communication channels such as email, SMS, and chat. This ensures alerts can be delivered to team members via their preferred channels, increasing the chances of swift response.
For instance, if a team member prefers receiving alerts through a chat platform, the Alertmanager can send alerts to that channel.
Rich Alert Context:
The Alertmanager includes:
- Contextual information in alert notifications.
- Providing relevant details such as the alert severity.
- Affected components.
- Additional metadata
This helps teams quickly understand the scope and impact of the alerts.
For example, when an alert is triggered for a specific service, the Alertmanager can include information about the service's current status, recent performance metrics, and related incidents.
The Role of Prometheus Alertmanager in Monitoring
Prometheus Alertmanager plays a crucial role in ensuring effective monitoring practices.
It enables you to manage and respond to alerts efficiently. When Prometheus generates an alert, it is sent to the Alertmanager, which applies the defined routing rules and delivers the alert notifications to the appropriate recipients.
By centralizing the alerting process, the Alertmanager helps prevent alert fatigue, a common issue in monitoring systems. Alert fatigue occurs when too many alerts are generated, leading to decreased responsiveness and effectiveness.
With the Alertmanager, you can prioritize and route alerts based on severity, ensuring that critical incidents receive immediate attention.
In addition to notification management, the Alertmanager provides a web interface for viewing and managing alerts. This interface allows you to acknowledge, silence, or group alerts for easier management and collaboration among team members.
Best practices for managing alerts with the Prometheus Alertmanager
The Prometheus Alertmanager provides powerful features for managing alerts and ensuring that the right people are notified of potential issues.
Here are some best practices for managing alerts with the Prometheus Alertmanager:
Define clear alerting rules:
Start by defining clear and concise alerting rules based on your specific needs. Consider the metrics and thresholds most relevant to your systems and applications.
Setting up specific, well-defined rules ensures you receive actionable alerts and minimize false positives.
Use labels for easy alert filtering:
Use labels to categorize and filter alerts based on various criteria. This allows easy identification and management of related alerts.
Group related alerts:
When multiple alerts occur for the same underlying issue, the Alertmanager can group them into a single incident. This makes managing and prioritizing alerts easier and reduces the likelihood of critical alerts being overlooked.
Define multiple alert receivers:
You can configure different receivers for different alert severity levels or specific types of alerts. This allows you to escalate critical alerts to on-call teams while sending less critical alerts to an internal monitoring system.
Set up silence periods:
Silence periods allow you to temporarily mute or suppress alerts during specific time frames, preventing unnecessary notifications during maintenance windows or known periods of high alert noise. Use silence periods strategically to ensure that alerts are only triggered when they are most relevant and actionable.

Regularly review and update alerting rules:
Monitor the effectiveness of your alerting rules and periodically review and update them as necessary. Regularly reviewing and updating your rules ensures you receive relevant and actionable alerts.
Integrate with incident management tools:
Integrating the Prometheus Alertmanager with incident management tools like Zenduty allows you to centralize your incident management workflow. These tools provide additional features for managing and resolving incidents, such as on-call schedules, escalation policies, and collaboration capabilities.
Monitor and analyze alerting patterns:
Continuously monitor and analyze the alerting patterns generated by the Alertmanager. This helps in identifying recurring patterns or anomalies in your systems and applications.
Why do you need Zenduty with Prometheus AlertManager?
Zenduty is a modern incident management platform that helps teams streamline their incident response process.
The Prometheus integration with Zenduty allows Prometheus alerts to be sent to the right team and notified to them based on on-call schedules via email, text messages (SMS), phone calls (Voice), Slack, Microsoft Teams, and iOS & Android push notifications. Alerts are also escalated until they are acknowledged or closed.
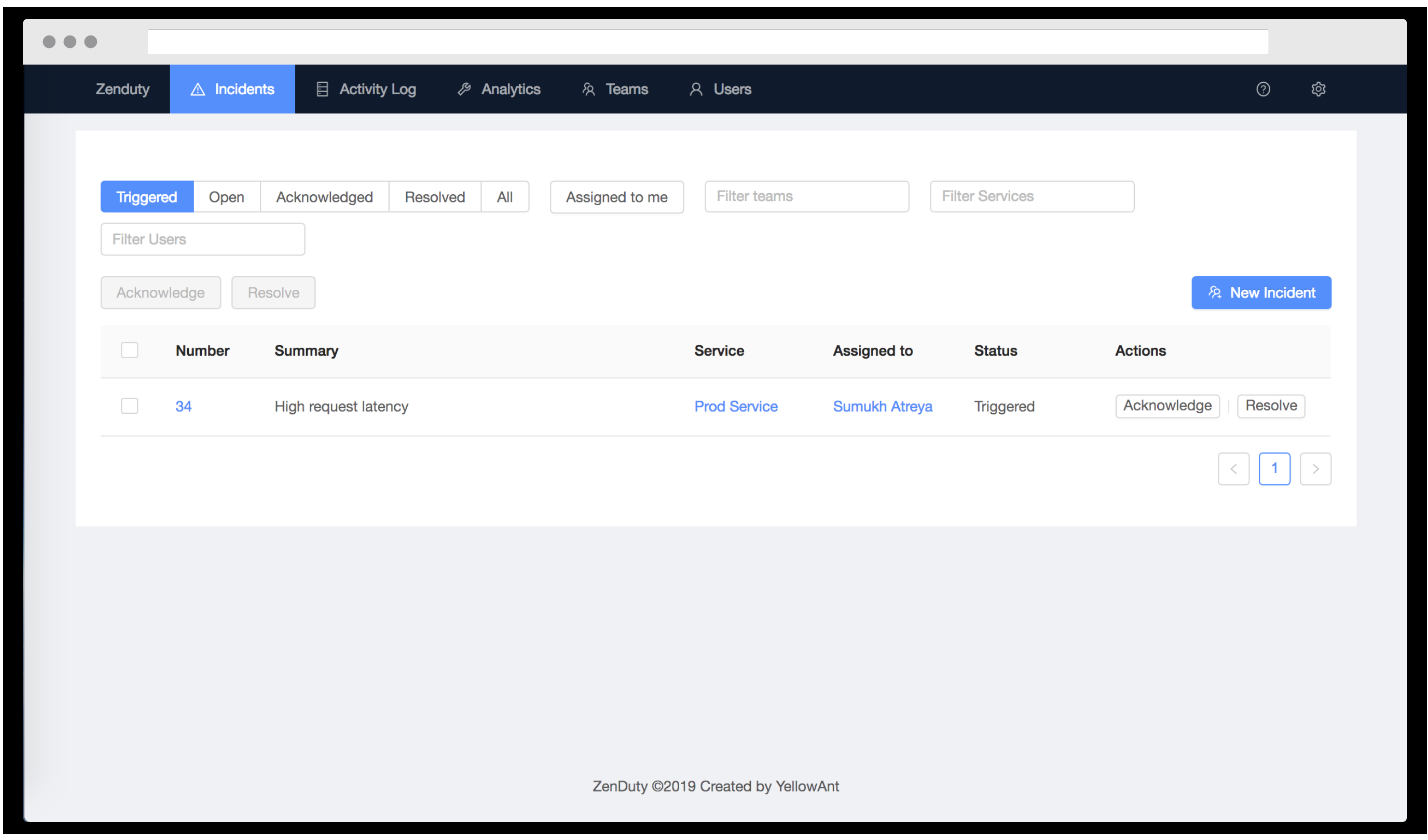
Whenever a Prometheus alert rule condition is triggered, an alert is created in Zenduty, which creates an incident.Zenduty will auto-resolve the incident when that condition returns to normal levels.
Benefits of using Prometheus Alertmanager with Zenduty
Integrating Prometheus Alertmanager with Zenduty offers several benefits, including:
Centralized incident management: All your alerts and incidents are tracked in one place, making managing and resolving them easier.
Customizable alert routing: Define routing rules based on your specific requirements. You can route alerts to the right teams or individuals within Zenduty, ensuring that the right people get notified at the right time.
Collaboration and communication: You can create chat channels, share updates, and discuss the incident in real time within Zenduty, improving collaboration and reducing resolution time.
Escalation and on-call management: You can set up on-call schedules, define escalation policies, and automatically notify the next person in line if an alert is not acknowledged or resolved within a specific timeframe.
How to use the Prometheus Alertmanager with Zenduty
Prometheus Alertmanager is a powerful tool for monitoring your systems and infrastructure for potential problems and Zenduty is a incident management platform that helps you manage alerts, collaborate on incidents, and track their resolution.
Integrating Prometheus Alertmanager with Zenduty allows you to create a seamless incident management process that ensures that incidents are detected, responded to, and resolved quickly and efficiently.
Using the Prometheus Alertmanager with Zenduty
To seamlessly integrate Prometheus with Zenduty, follow these steps:
In Zenduty:
- Navigate to the "Teams" section in Zenduty and select the specific team you wish to add to the integration.
- Find the "Services" tab inside the chosen team and click on the service relevant to your integration.
- Under "Integrations," locate and click on the option to "Add New Integration." You'll be prompted to provide a name for the integration. From the application options, pick "Prometheus."
- After creating the integration, go to the "Configure" section within your Integrations settings. You can find and copy the Webhook URL automatically generated for your Prometheus integration here.
In Prometheus:
- Ensure you have Prometheus and Prometheus Alertmanager downloaded and available on your local system. If you still need to do so, you can download them here.
- Navigate to your system's "Alertmanager Folder" and open the "alertmanager.yml" file.
- In the "alertmanager.yml" file, under "Webhook Configs," insert the webhook URL you copied in the earlier steps.
After this addition, your "alertmanager.yml" file should resemble the following:


Tip: If you need to create alerts that span multiple Zenduty Services, you can define your Alert Rules in separate files. For instance, use files like "first_rules.yml," "second_rules.yml," and more, each configured with a distinct integration endpoint.
In the Prometheus directory, access the "prometheus.yml" file. Include the newly created rules files and specify the desired target. Remember that Zenduty organizes Prometheus alerts based on the "alertname" parameter.
So, your "prometheus.yml" should appear as follows:

Start Prometheus and Alertmanager with commands like:
- run prometheus: ./prometheus --config.file=prometheus.yml
- run alertmanager: ./alertmanager --config.file=alertmanager.yml
Once Prometheus is up and running, you'll be able to see the configured alert rules in action.
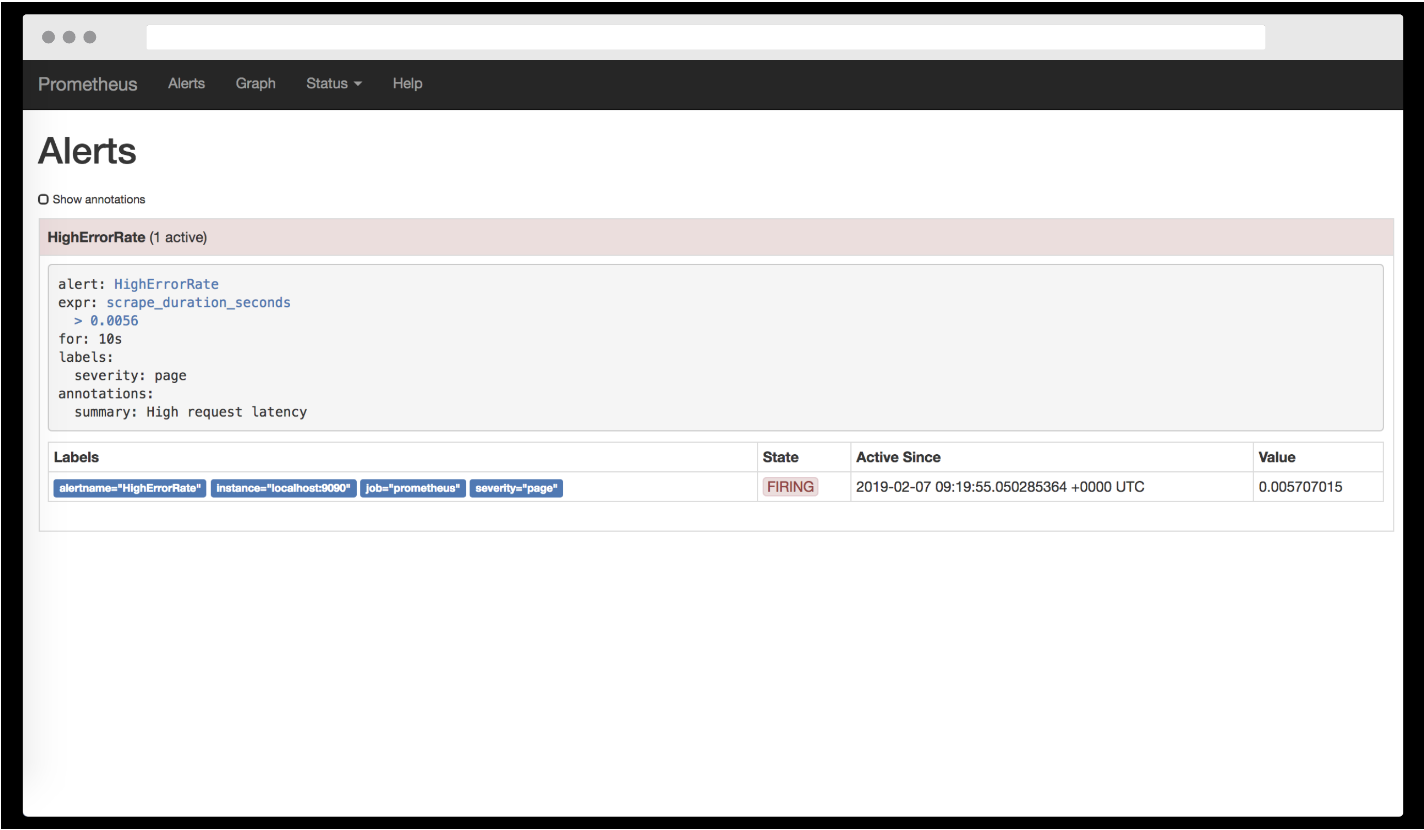
When an alert is triggered, Zenduty will automatically generate an incident.
How to create and escalate alert rules
Zenduty alert rules allow you to automate the process of creating and escalating alerts based on specific conditions. This can help you to reduce the time it takes to respond to incidents and improve the overall reliability of your systems.
Here's a detailed blog for you to help you escalate alerts to Zenduty:

Conclusion
Integrating Prometheus Alertmanager with Zenduty offers a seamless incident management experience. From setting up Prometheus Alertmanager to optimizing your alert management process, leveraging the integration between Prometheus Alertmanager and Zenduty enables you to streamline your incident response and ensure the continuous availability of your services.
Resources for learning more about the Prometheus Alertmanager and Zenduty

 Prometheus
Anjali Udasi
As a technical writer, I love simplifying technical terms and write on latest technologies.
